Copyright
©The Author(s) 2018.
World J Gastroenterol. Jan 14, 2018; 24(2): 216-225
Published online Jan 14, 2018. doi: 10.3748/wjg.v24.i2.216
Published online Jan 14, 2018. doi: 10.3748/wjg.v24.i2.216
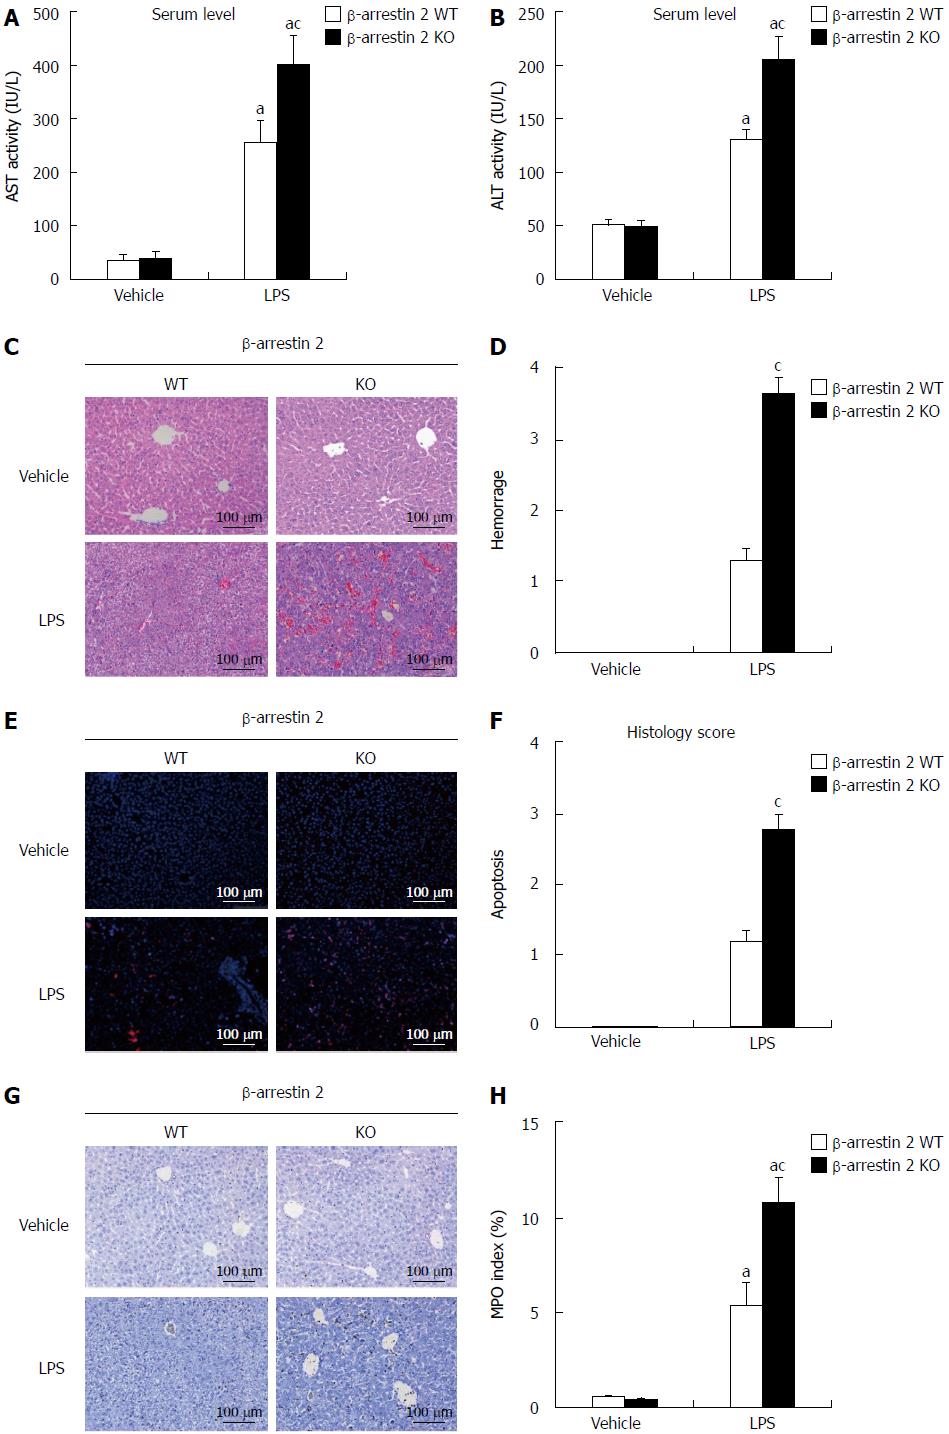
Figure 1 Evaluation of lipopolysaccharide-induced liver injury in vivo .
A and B: Serum levels of ALT and AST were detected using ELISA kits in β-arrestin 2 WT and β-arrestin 2 KO mice treated with LPS and vehicle; C: HE staining of liver tissue (magnification, × 200); D: Histology score of hemorrhage in β-arrestin 2 WT and KO mice treated with LPS and vehicle; E: TUNEL staining of liver tissue (magnification, × 200); F: Histology score of apoptosis in β-arrestin 2 WT and KO mice treated with LPS and vehicle; G: Immunohistochemical staining for MPO expression in liver tissues from β-arrestin 2 WT and β-arrestin 2 KO mice treated with LPS and vehicle, (magnification, × 200); H: MPO index in β-arrestin 2 WT and β-arrestin 2 KO mice treated with LPS and vehicle. aP < 0.05 vs vehicle control group; cP < 0.05 vs β-arrestin 2 WT mice. LPS: Lipopolysaccharide.
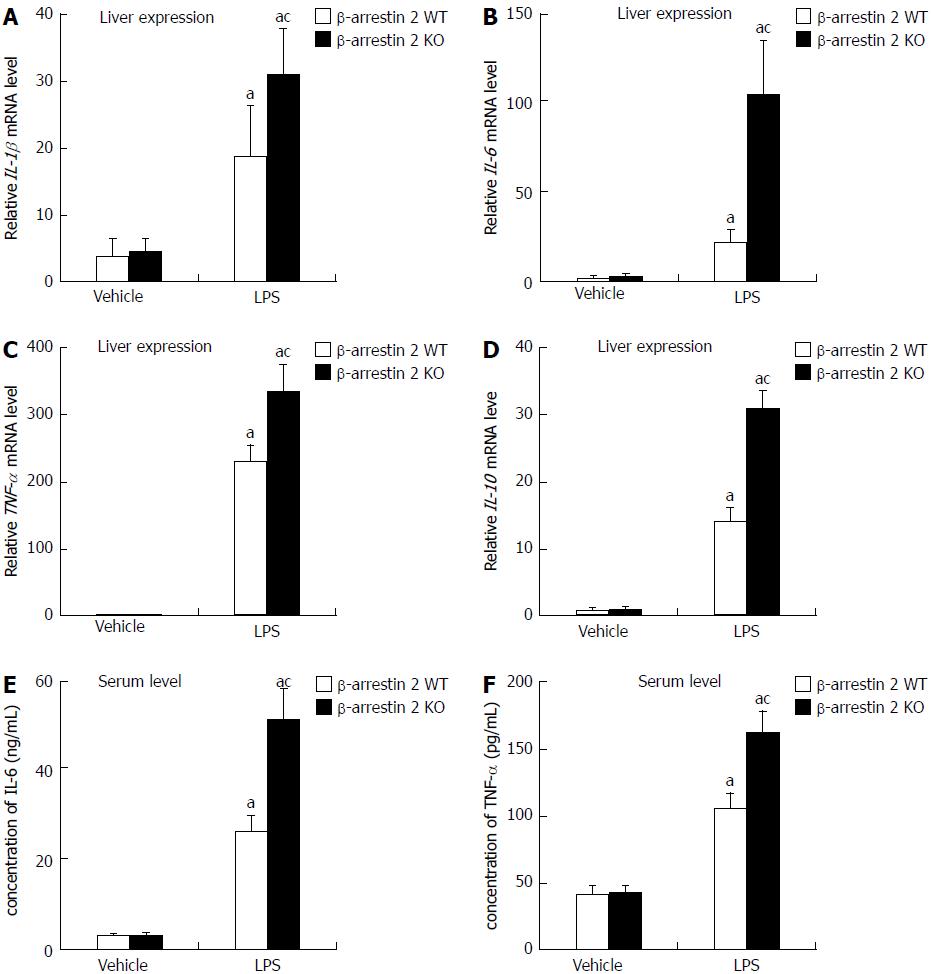
Figure 2 Expression of inflammatory factors induced by lipopolysaccharide in vivo.
qRT-PCR was used to determine relative mRNA levels of IL-1β (A), IL-6 (B), TNF-α (C), and IL-10 (D) in liver tissues; E and F: ELISA was used to determine levels of IL-6 and TNF-α in serum. aP < 0.05 vs control group; cP < 0.05 vs β-arrestin 2 WT mice.
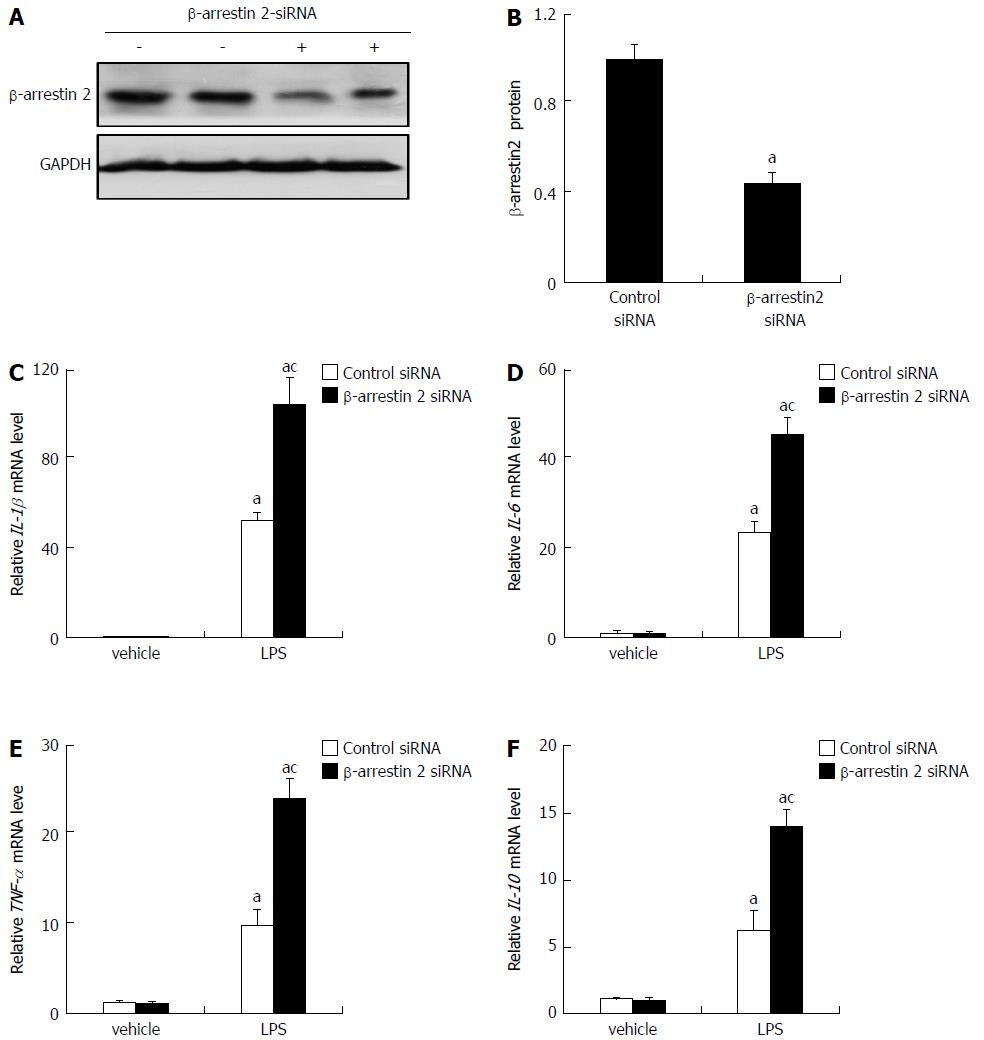
Figure 3 Expression of inflammatory factors by RAW264.
7 cells in vitro. A: Expression of β-arrestin 2 in RAW264.7 cells was detected by Western blot. Levels of GAPDH are shown as a loading control; B: Relative quantitative evaluation of the Western blot analysis for β-arrestin 2 expression with ImageJ software, C-F: qRT-PCR was used to determine relative mRNA levels of IL-1β (C), IL-6 (D), TNF-α (E), and IL-10 (F) produced by RAW264.7 cells. aP < 0.05 vs vehicle group; cP < 0.05 vs control siRNA group.
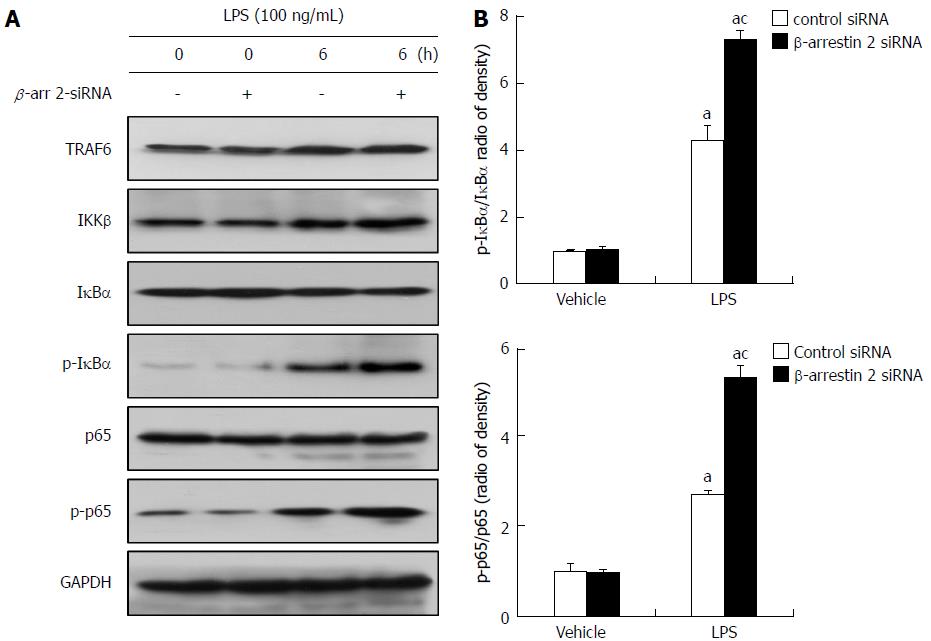
Figure 4 Expression of key molecules involved in the TLR4/NF-κB signaling pathway in vitro.
A: Western blot analysis of the expression of key molecules involved in the TLR4/NF-κB signaling pathway. The levels of GAPDH are shown as a loading control; B: Relative gray value quantitative evaluation for p-IκBα/IκBα and p-p65/p65. aP < 0.05 vs vehicle control; cP < 0.05 vs control siRNA group.
- Citation: Jiang MP, Xu C, Guo YW, Luo QJ, Li L, Liu HL, Jiang J, Chen HX, Wei XQ. β-arrestin 2 attenuates lipopolysaccharide-induced liver injury via inhibition of TLR4/NF-κB signaling pathway-mediated inflammation in mice. World J Gastroenterol 2018; 24(2): 216-225
- URL: https://www.wjgnet.com/1007-9327/full/v24/i2/216.htm
- DOI: https://dx.doi.org/10.3748/wjg.v24.i2.216


