Copyright
©The Author(s) 2018.
World J Gastroenterol. Apr 28, 2018; 24(16): 1779-1794
Published online Apr 28, 2018. doi: 10.3748/wjg.v24.i16.1779
Published online Apr 28, 2018. doi: 10.3748/wjg.v24.i16.1779
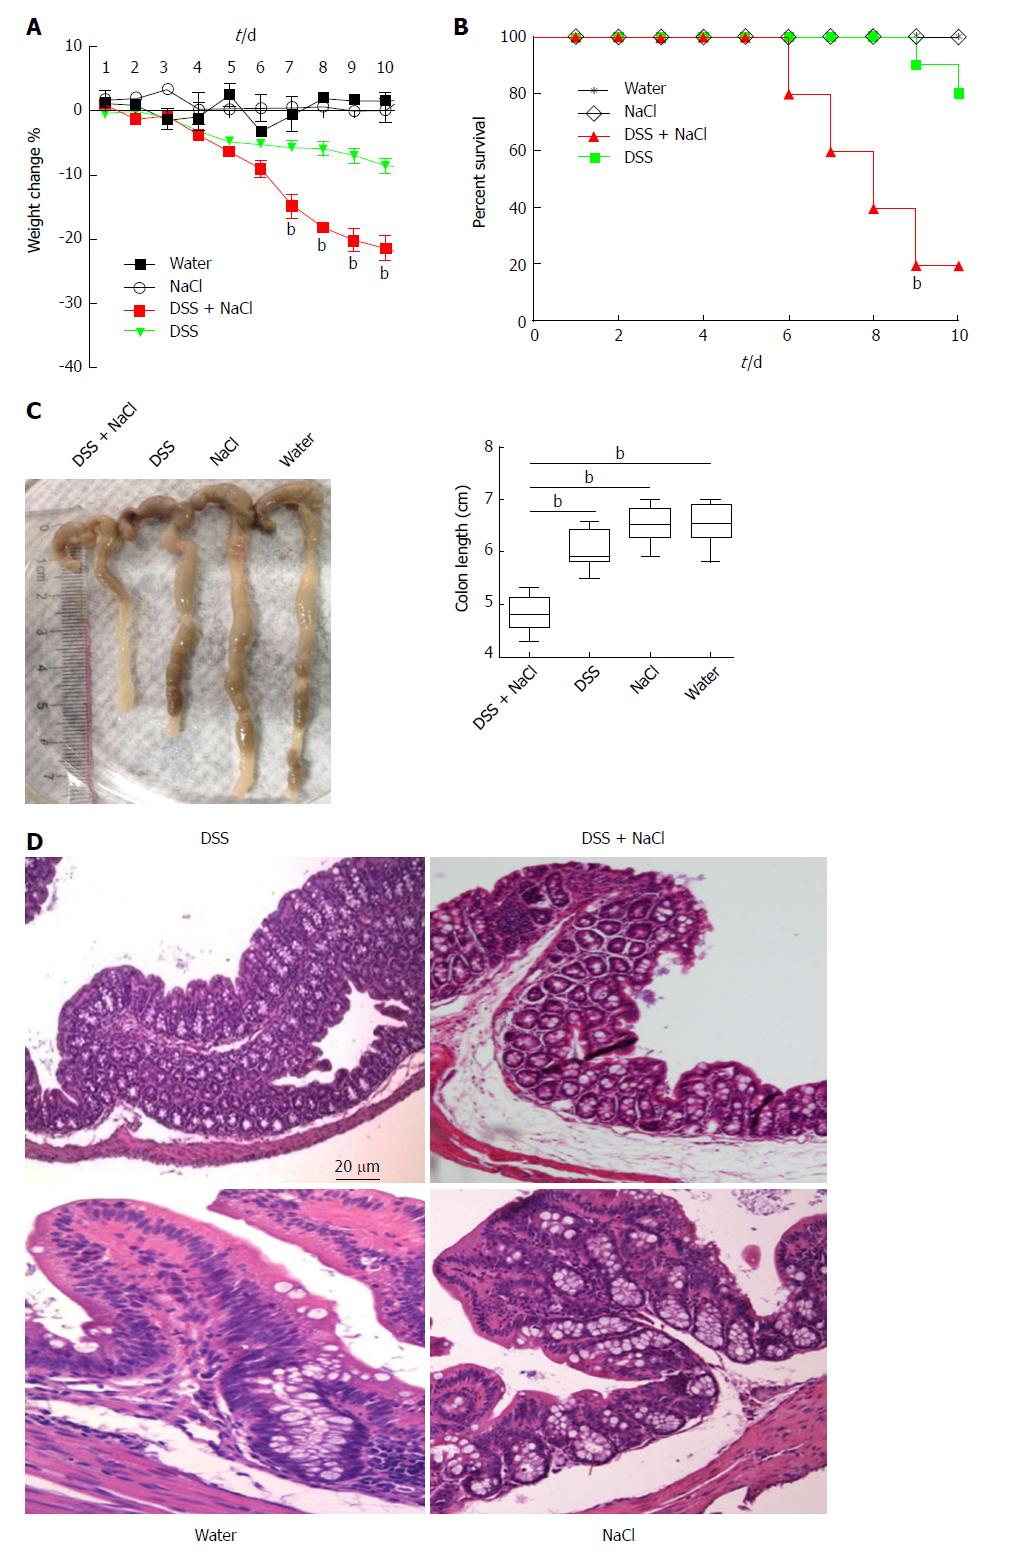
Figure 1 Mice treated with DSS and NaCl develop more severe colitis.
A: Mice were given DSS and/or NaCl, and were weighed daily; B: Death status was recorded daily; C: Colonic tissues were collected from four groups of mice and colonic length was measured; D: Histological analyses show sections of the colon stained with HE for DSS- or NaCl-treated mice. In all the panels, data indicate three separate experiments, whereby 10 mice per group were used in each experiment. aP < 0.05; bP < 0.01; cP < 0.001. DSS: Dextran sulfate sodium.
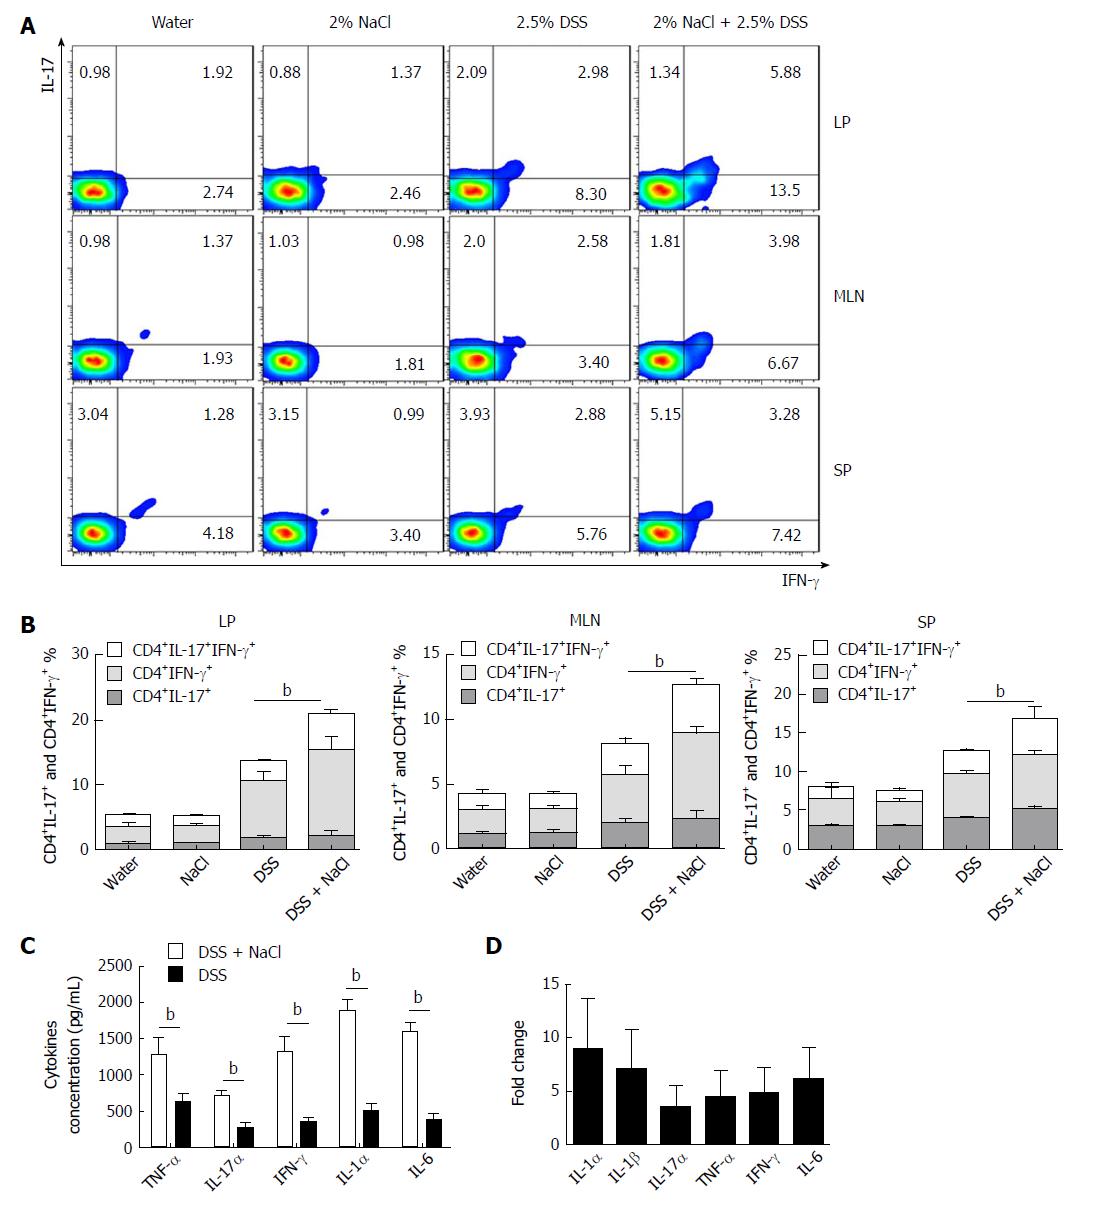
Figure 2 NaCl promotes CD4+IFN-γ+IL-17+ T cell increase and inflammatory cytokine secretion in DSS-treated mice.
A: The CD4+IFN-γ+IL-17+ T cells in LP, MLN and SP from mice treated with NaCl and/or DSS were detected by flow cytometry; B: Combined flow cytometry data of CD4+IL-17+, CD4+IFN-γ+ and CD4+IFN-γ+IL-17+ T cell subsets distribution in LP, MLN and SP; C: Colon tissues collected from mice treated with DSS or DSS + NaCl, which were washed with phosphate-buffered saline and cultured for 24 h, and the supernatants were collected and detected by enzyme-linked immunosorbent assay; D: Colon tissues collected from mice treated with NaCl and DSS (or only DSS) were detected by RT-PCR. The relative fold-change in DSS + NaCl-treated mice vs DSS-treated mice. In all the panels, data indicate three separate experiments, whereby 3 mice per group were used in each experiment. aP < 0.05; bP < 0.01; cP < 0.001. DSS: Dextran sulfate sodium; LP: Lamina propria; MLN: Mesenteric lymph node; SP: Spleen.
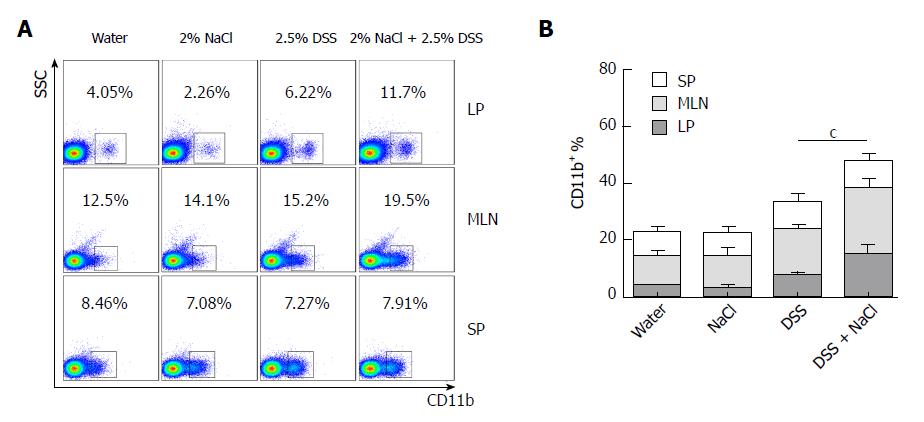
Figure 3 CD11b+ macrophages are increased in DSS- and NaCl-treated mice.
A: The CD11b+ cells in LP, MLN and SP from the four groups were detected by flow cytometry; B: Quantification of the flow cytometry data indicates the CD11b+ cell distribution in LP, MLN and SP. In the panels, data indicate three separate experiments, whereby 3 mice per group were used in each experiment. aP < 0.05; bP < 0.01; cP < 0.001. DSS: Dextran sulfate sodium; LP: Lamina propria; MLN: Mesenteric lymph node; SP: Spleen.
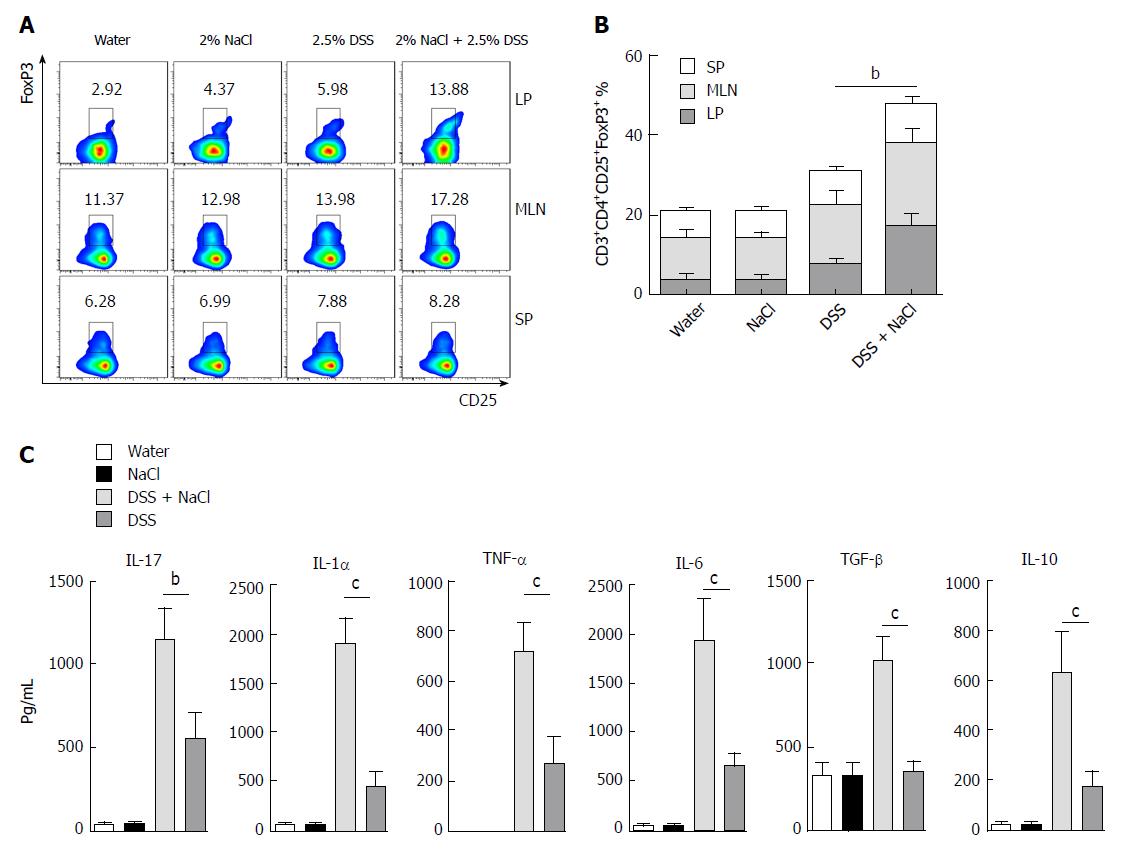
Figure 4 CD3+CD4+CD25+Foxp3+ T cells are increased in mice treated with DSS and NaCl.
A: CD3+CD4+CD25+Foxp3+ T cells in LP, MLN and SP from animal models were detected by flow cytometry; B: A summary of the percentages of CD3+CD4+CD25+Foxp3+ T cell distribution in LP, MLN and SP; C: LPMCs from the four groups were isolated and cultured for 24 h, and the levels of cytokines in the culture supernatants were collected and analyzed by enzyme-linked immunosorbent assay. In all the panels, data indicate three separate experiments, whereby 3 mice per group were used in each experiment. aP < 0.05; bP < 0.01; cP < 0.001 vs the DSS group. DSS: Dextran sulfate sodium; LMPCs: Lamina propria mononuclear cells; LP: Lamina propria; MLN: Mesenteric lymph node; SP: Spleen.
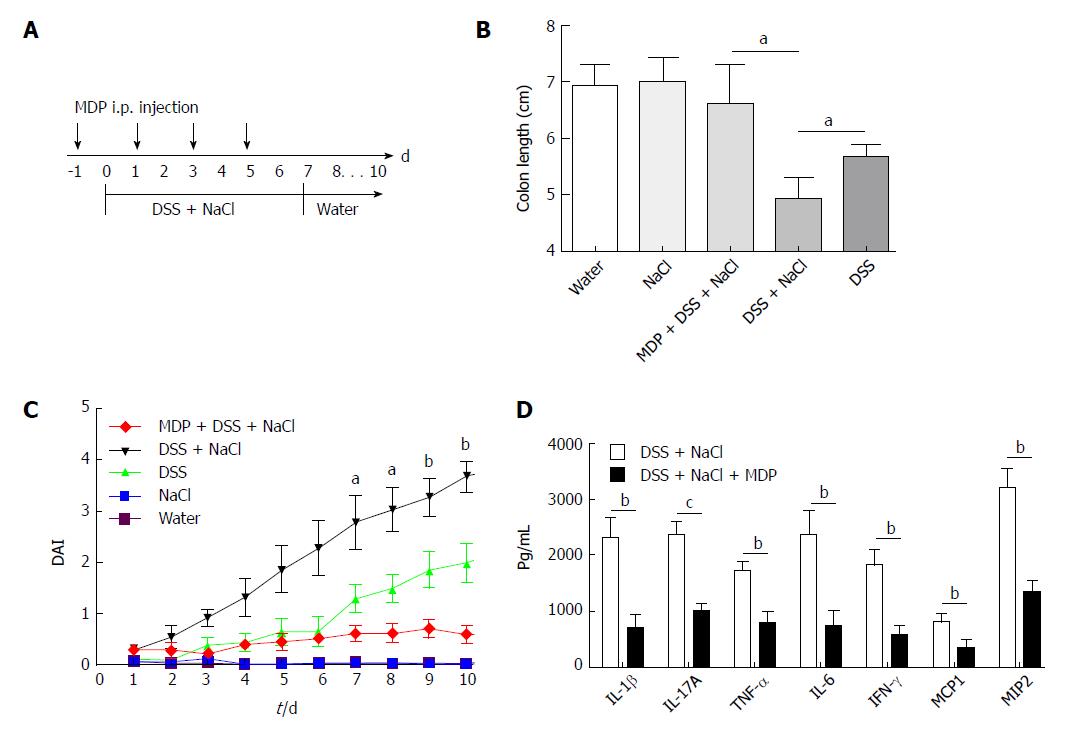
Figure 5 Depletion of macrophages reduces the severity of DSS-induced colitis promoted by NaCl.
A: Clodronate liposomes (denoted as MDP) or control PBS-liposomes (denoted as PBS) were administrated intravenously to all mice, as the schematic protocol indicated during DSS and NaCl treatment; B: The disease activity index was monitored daily; C: Colon length was measured in each group of mice (n = 10); D: Colon explants were cultured for 24 h and the inflammatory cytokines in supernatants were detected by enzyme-linked immunosorbent assay (n = 3). aP < 0.05; bP < 0.01; cP < 0.001 (clodronate liposomes + DSS + NaCl vs DSS + NaCl). DSS: Dextran sulfate sodium.
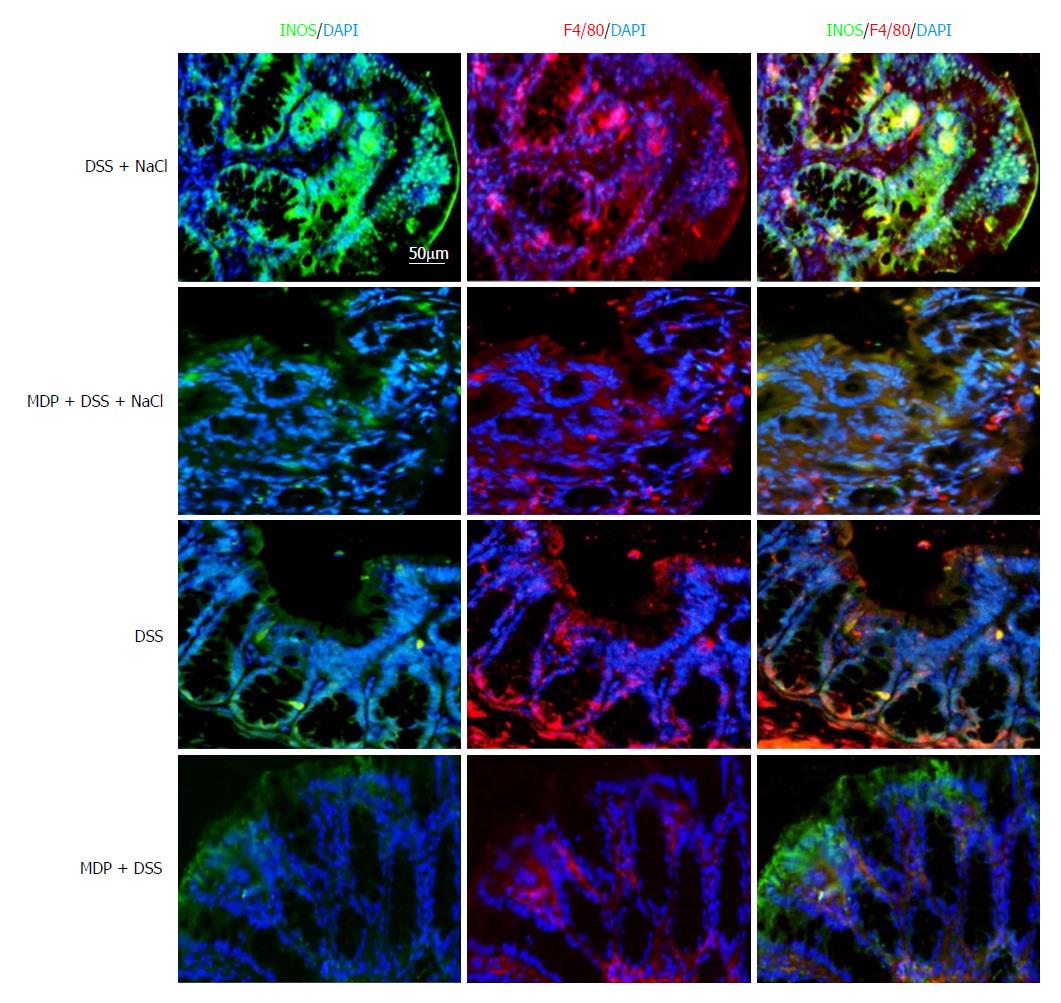
Figure 6 iNOS+F4/80+ macrophages increase in the colon of DSS- and NaCl-treated mice.
Macrophages in colon tissue obtained from mice injected intraperitoneally with PBS-containing liposomes (denoted as PBS), or clodronate liposomes (denoted as MDP) during the NaCl and DSS treatment were analyzed. The sections were stained with antibodies of anti-F4/80 (red) and anti-iNOS (green). Nuclei were stained with DAPI (blue). Laser confocal microscopy was used to detect fluorescence. (Scale bar = 50 μm). DSS: Dextran sulfate sodium; iNOS: inducible nitric oxide synthase.
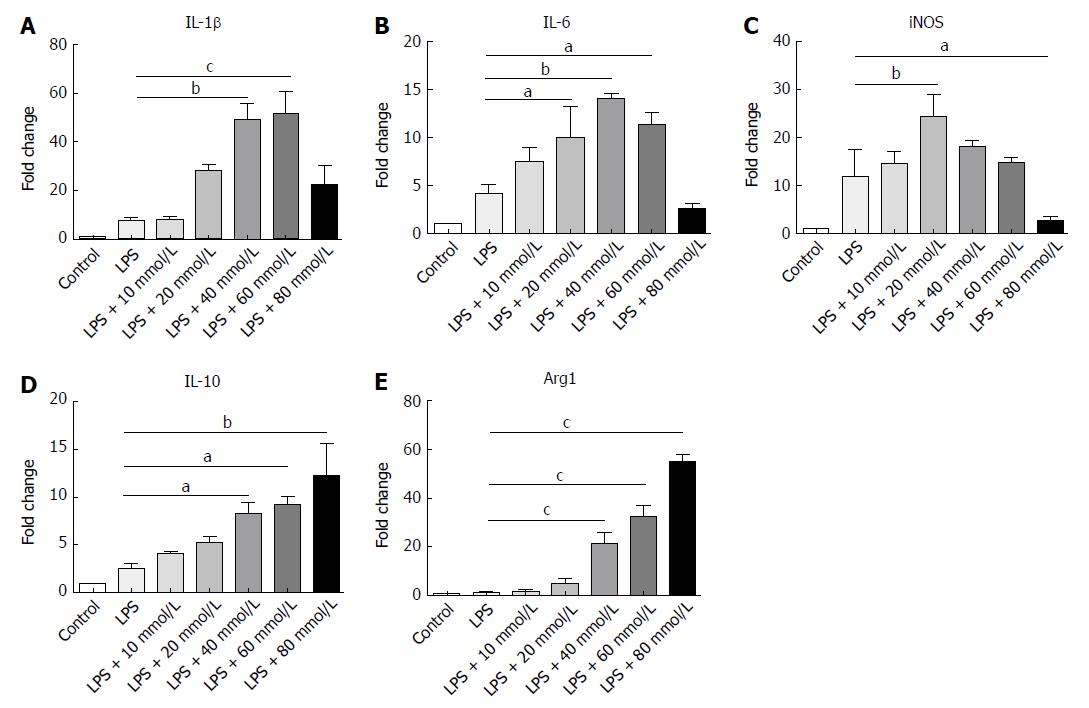
Figure 7 High NaCl levels enhance proinflammation gene expression in LPS-activated peritoneal macrophage.
A-E: Peritoneal macrophages were stimulated with different NaCl concentrations (10-80 mmol/L) in the presence of LPS for 24 h. mRNA expression was measured by RT-PCR for the indicated genes. In all the panels, data indicate three separate experiments. aP < 0.05; bP < 0.01; cP < 0.001. LPS: Lipopolysaccharide.
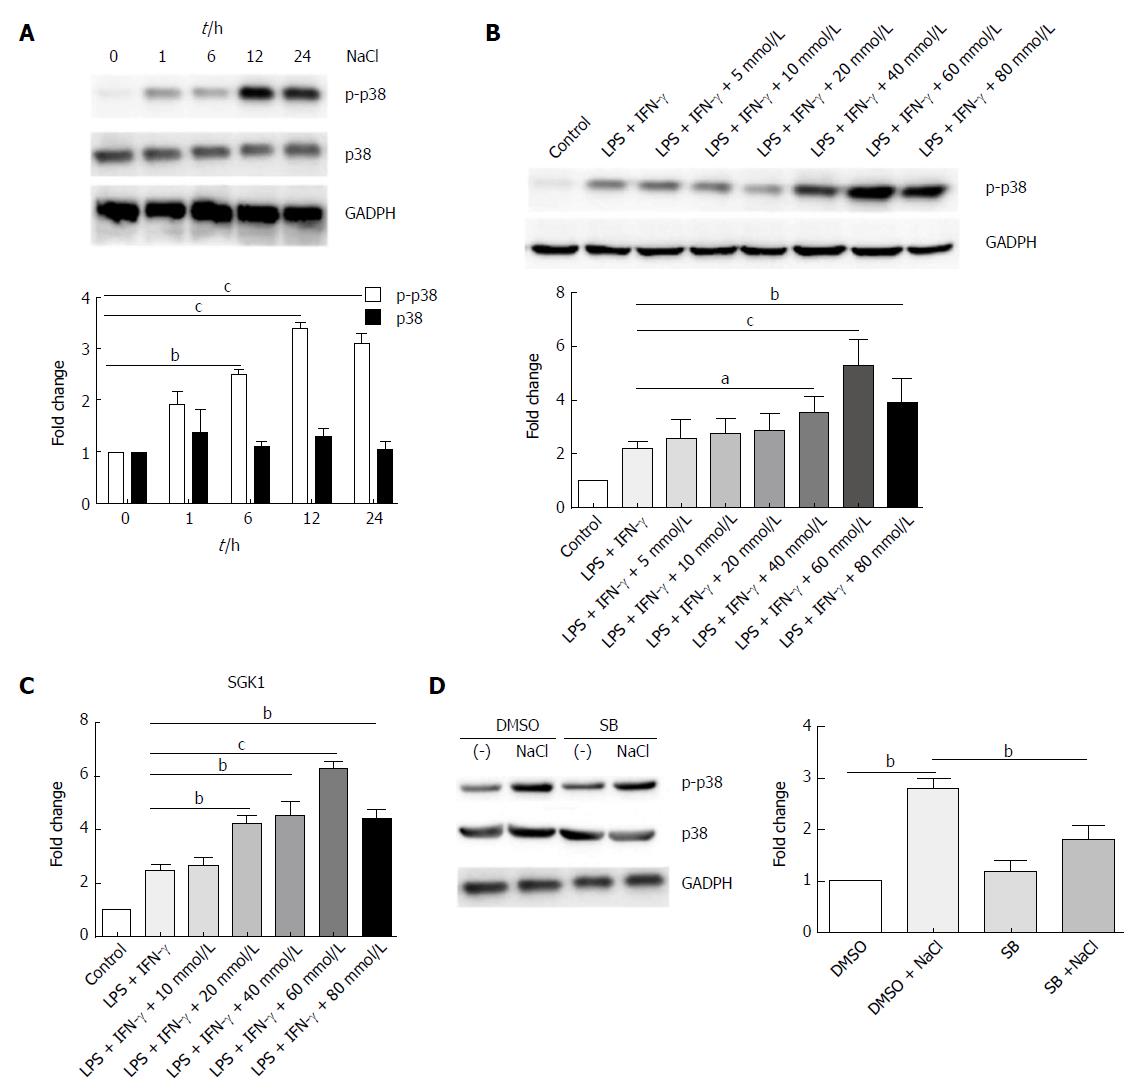
Figure 8 NaCl promotion of inflammation relies on the p38/MAPK pathway.
A: LPMCs were stimulated with 60 mmol/L NaCl in the presence of 100 ng/mL LPS and 20 ng/mL IFN-γ for 1 h, 6 h, 12 h and 24 h, and the p38 and phosphorylated-p38 proteins were detected by western blot; B: LPMCs were stimulated with different NaCl concentrations in the presence of 100 ng/mL LPS and 20 ng/mL IFN-γ for 24 h and phosphorylated p38 protein was detected by western blot; C: LPMCs were stimulated with different NaCl concentrations in the presence of LPS and IFN-γ, and the mRNA expression of SGK1 was measured by RT-PCR; D: LPMCs were pretreated with 10 μmol/L SB or DMSO for 2 h and were subsequently stimulated with 60 mmol/L NaCl along with 100 ng/mL LPS and 20 ng/mL IFN-γ in the presence of DMSO or 10 μmol/L SB for 24 h and the proteins of p38 and phosphorylated-p38 were detected by western blot. In all the panels, data indicate three separate experiments. aP < 0.05; bP < 0.01; cP < 0.001. DSS: Dextran sulfate sodium; LMPCs: Lamina propria mononuclear cells; LP: Lamina propria; LPS: Lipopolysaccharide; MLN: Mesenteric lymph node; SB: SB20358; SP: Spleen.
- Citation: Guo HX, Ye N, Yan P, Qiu MY, Zhang J, Shen ZG, He HY, Tian ZQ, Li HL, Li JT. Sodium chloride exacerbates dextran sulfate sodium-induced colitis by tuning proinflammatory and antiinflammatory lamina propria mononuclear cells through p38/MAPK pathway in mice. World J Gastroenterol 2018; 24(16): 1779-1794
- URL: https://www.wjgnet.com/1007-9327/full/v24/i16/1779.htm
- DOI: https://dx.doi.org/10.3748/wjg.v24.i16.1779


