Copyright
©The Author(s) 2018.
World J Gastroenterol. Apr 21, 2018; 24(15): 1666-1678
Published online Apr 21, 2018. doi: 10.3748/wjg.v24.i15.1666
Published online Apr 21, 2018. doi: 10.3748/wjg.v24.i15.1666
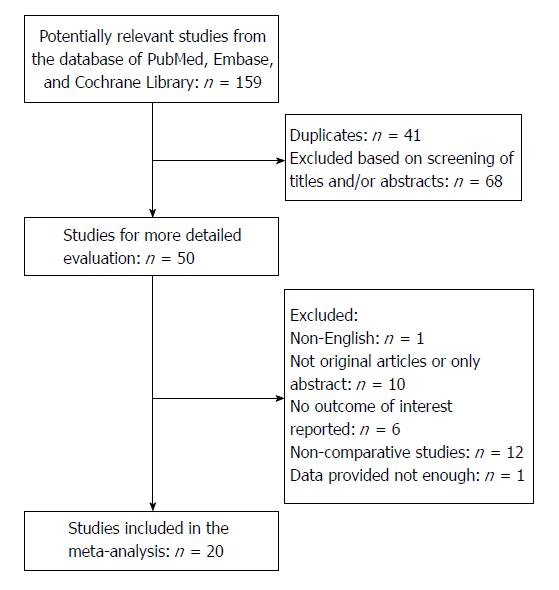
Figure 1 The diagram of selected studies for this meta-analysis.
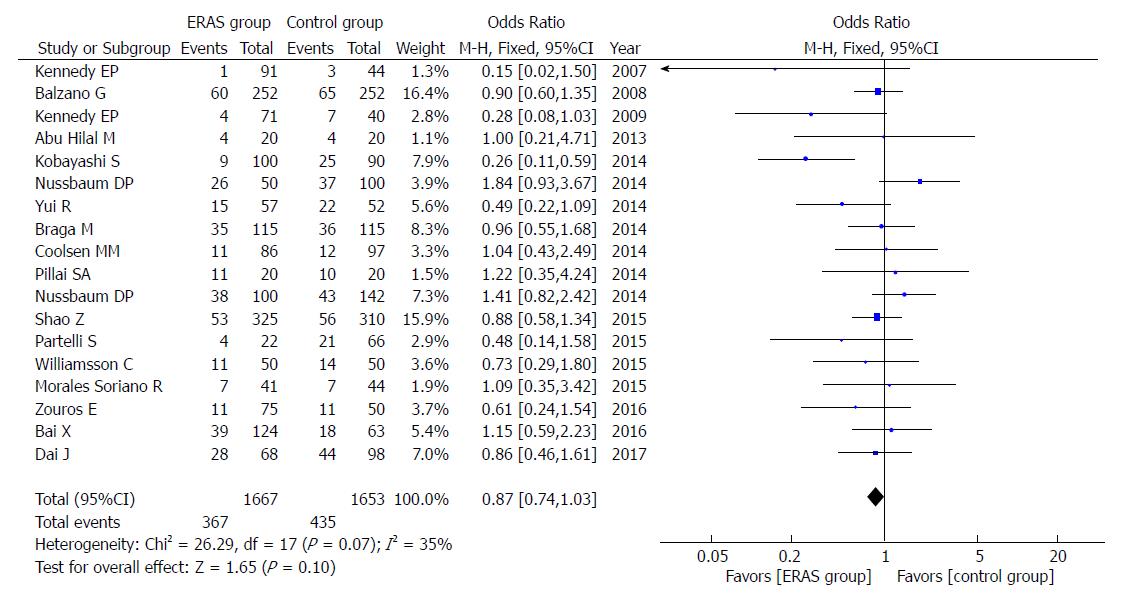
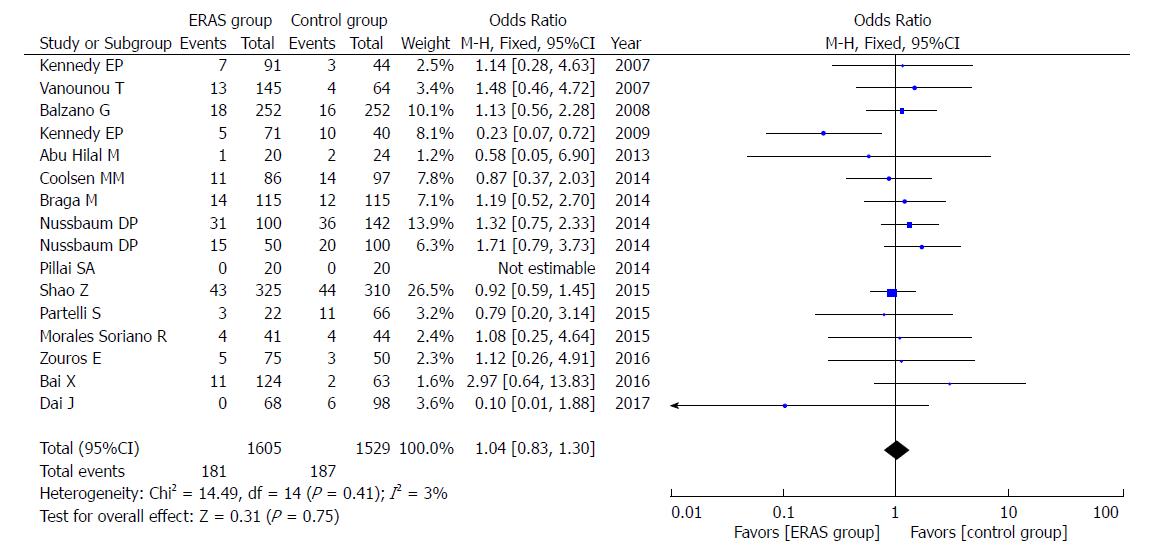
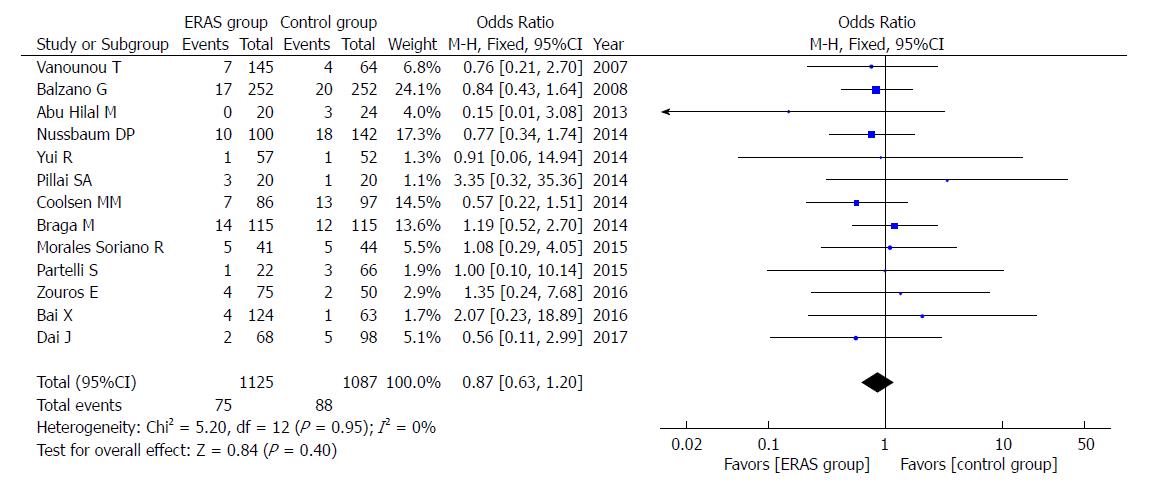
Figure 2 Forest plots demonstrating the outcomes of postoperative pancreatic fistula.
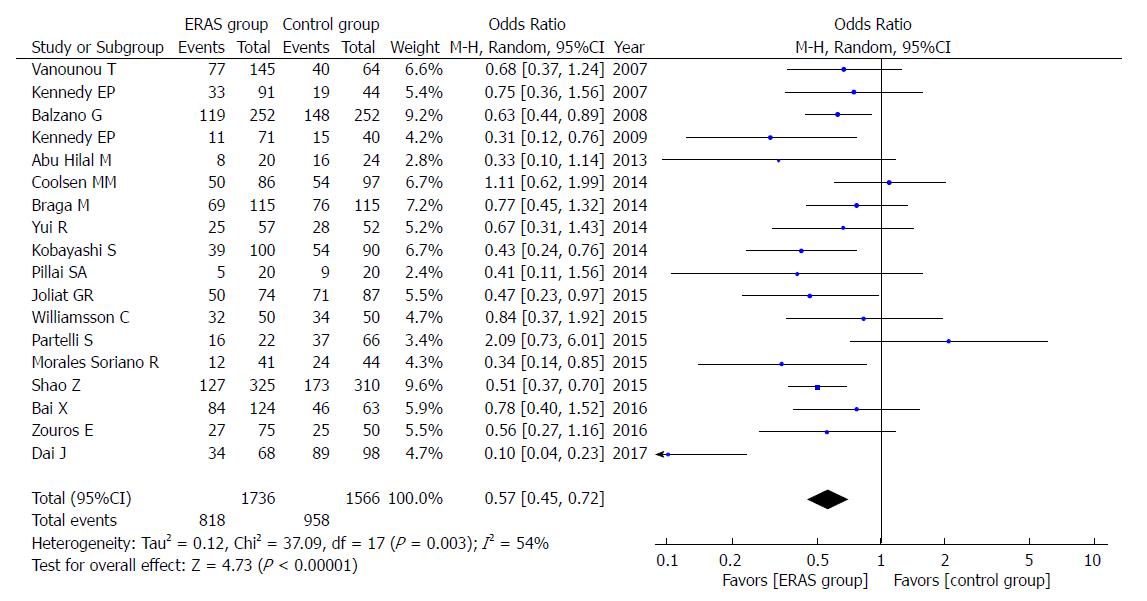
Figure 3 Forest plots demonstrating the outcomes of delayed gastric emptying.
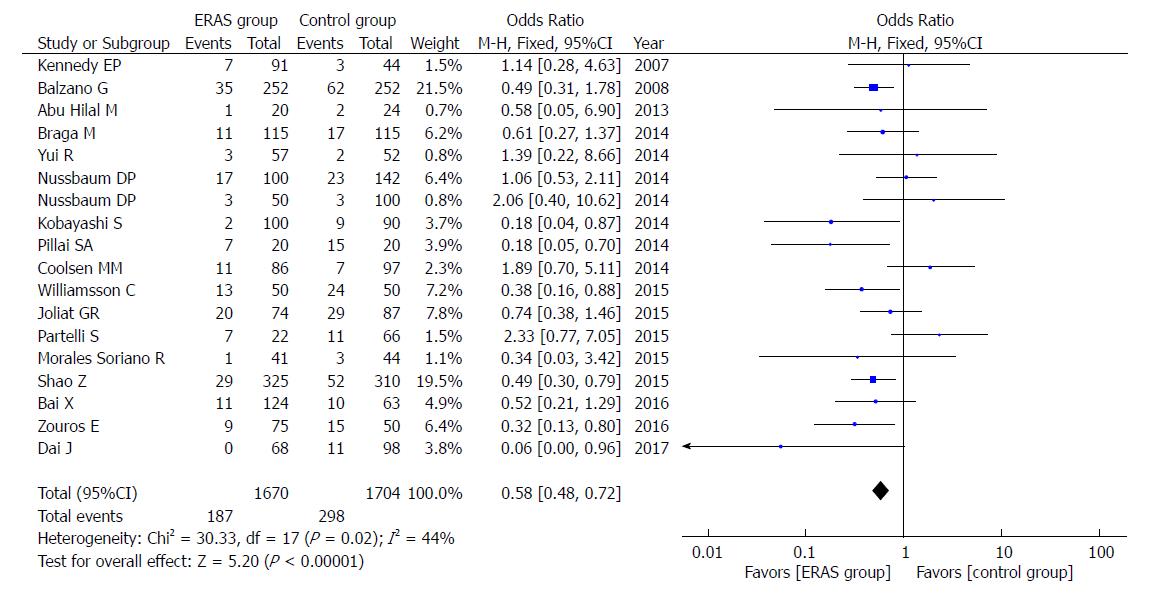
Figure 4 Forest plots demonstrating the outcomes of overall complications.
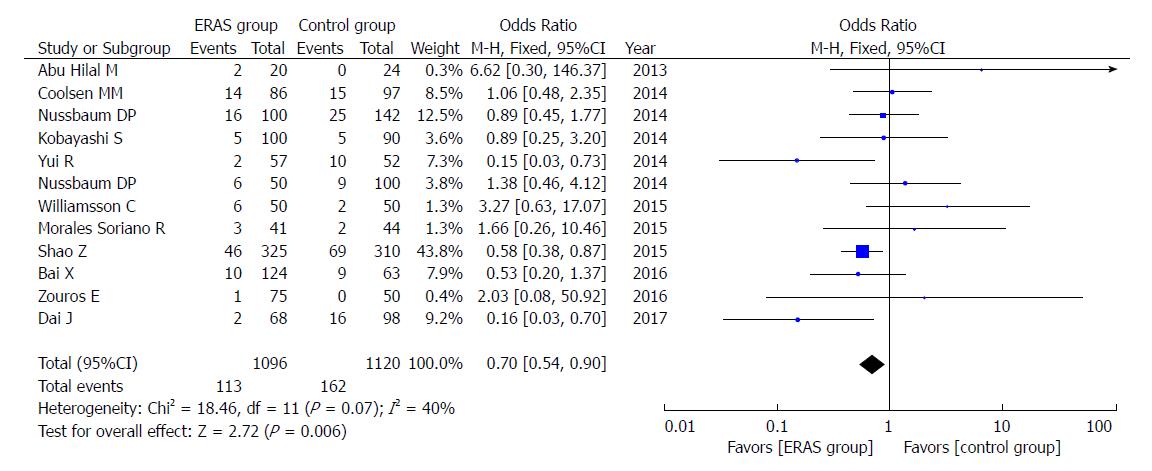
Figure 5 Forest plots demonstrating the outcomes of mild complications.
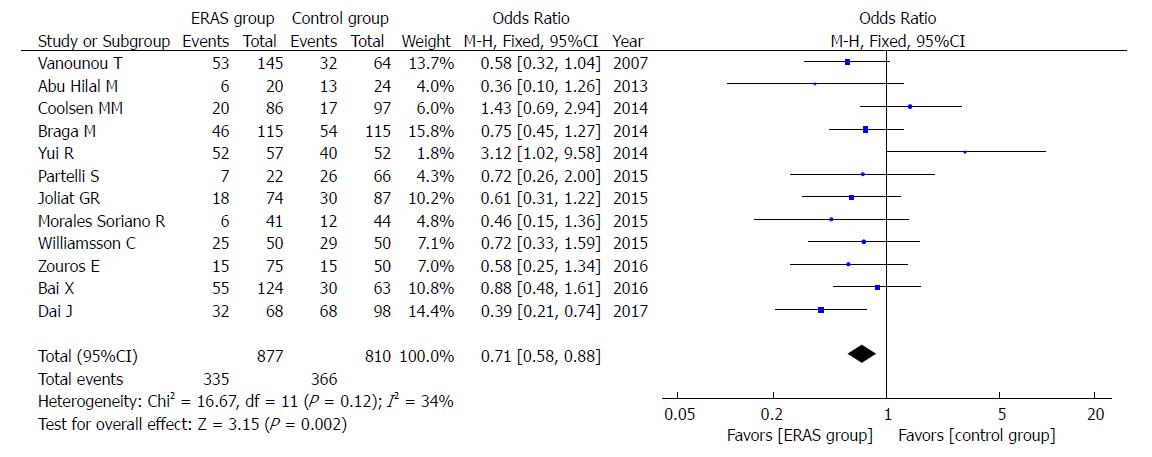
Figure 6 Forest plots demonstrating the outcomes of abdominal infection.
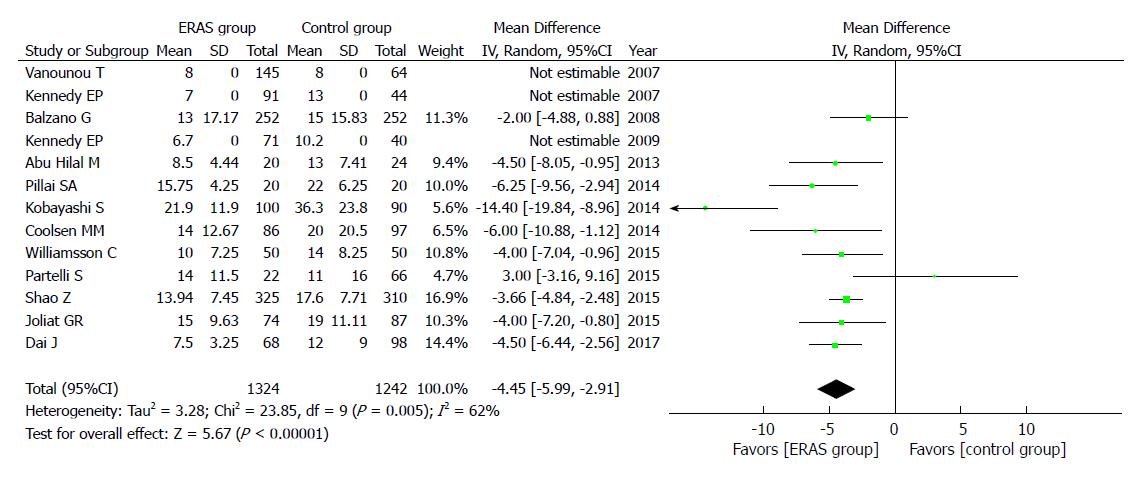
Figure 7 Forest plots demonstrating the outcomes of postoperative length of hospital stay.
Figure 8 Forest plots demonstrating the outcomes of mortality.
Figure 9 Forest plots demonstrating the outcomes of readmission.
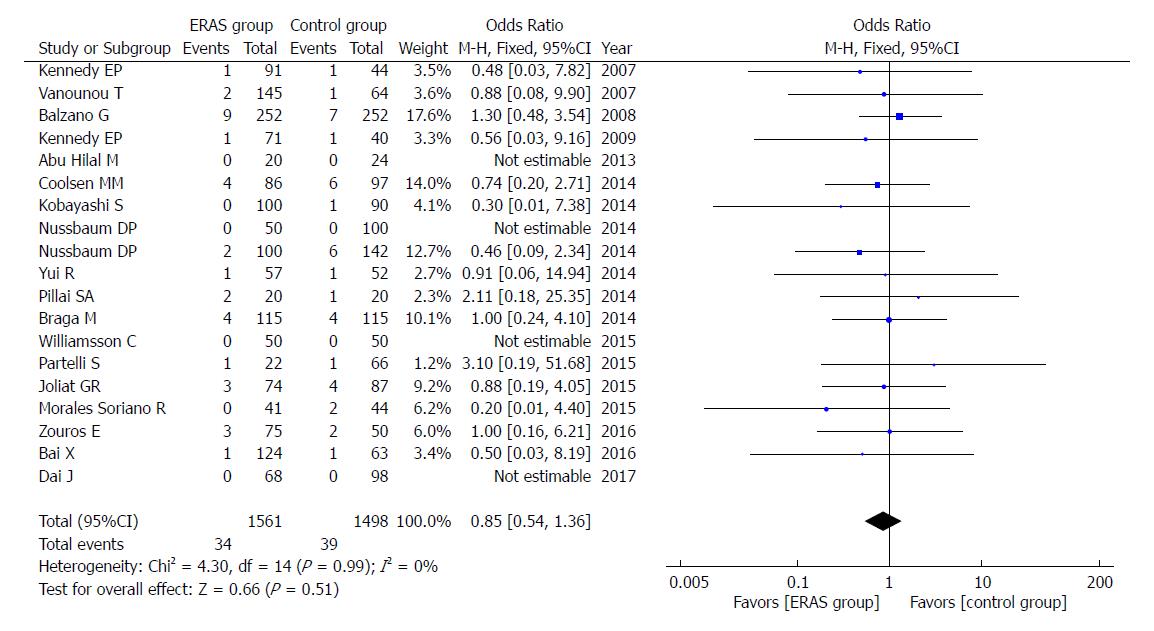
Figure 10 Forest plots demonstrating the outcomes of unintended reoperation.
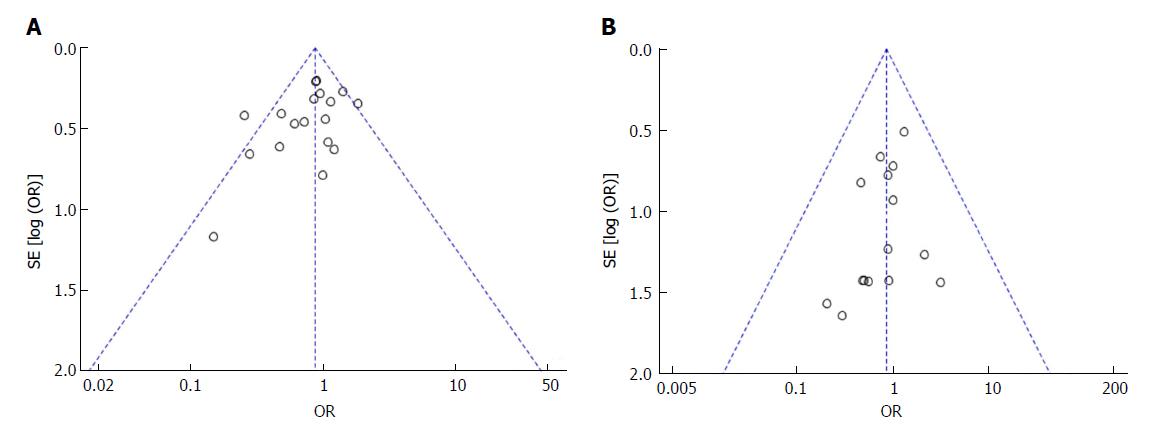
Figure 11 The funnel plots were used to evaluate potential publication bias.
A: POPF; B: Mortality.
- Citation: Ji HB, Zhu WT, Wei Q, Wang XX, Wang HB, Chen QP. Impact of enhanced recovery after surgery programs on pancreatic surgery: A meta-analysis. World J Gastroenterol 2018; 24(15): 1666-1678
- URL: https://www.wjgnet.com/1007-9327/full/v24/i15/1666.htm
- DOI: https://dx.doi.org/10.3748/wjg.v24.i15.1666


