Copyright
©The Author(s) 2018.
World J Gastroenterol. Apr 21, 2018; 24(15): 1601-1615
Published online Apr 21, 2018. doi: 10.3748/wjg.v24.i15.1601
Published online Apr 21, 2018. doi: 10.3748/wjg.v24.i15.1601
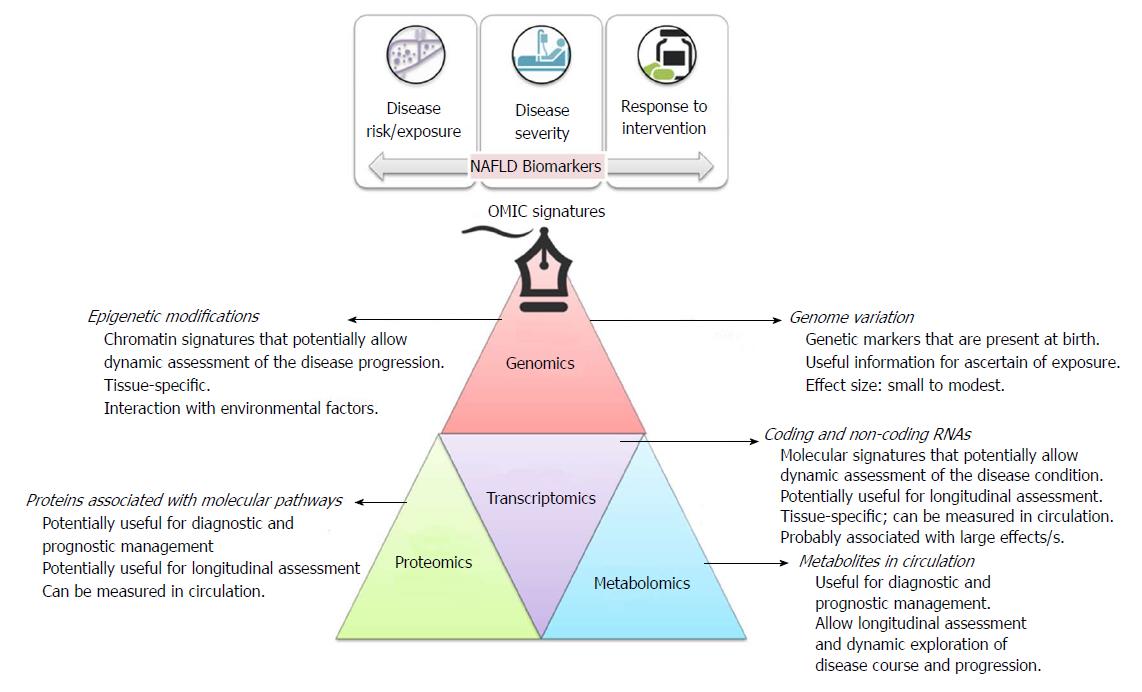
Figure 1 Brief description of OMICs signatures, including their main applications as biomarkers in clinical practice.
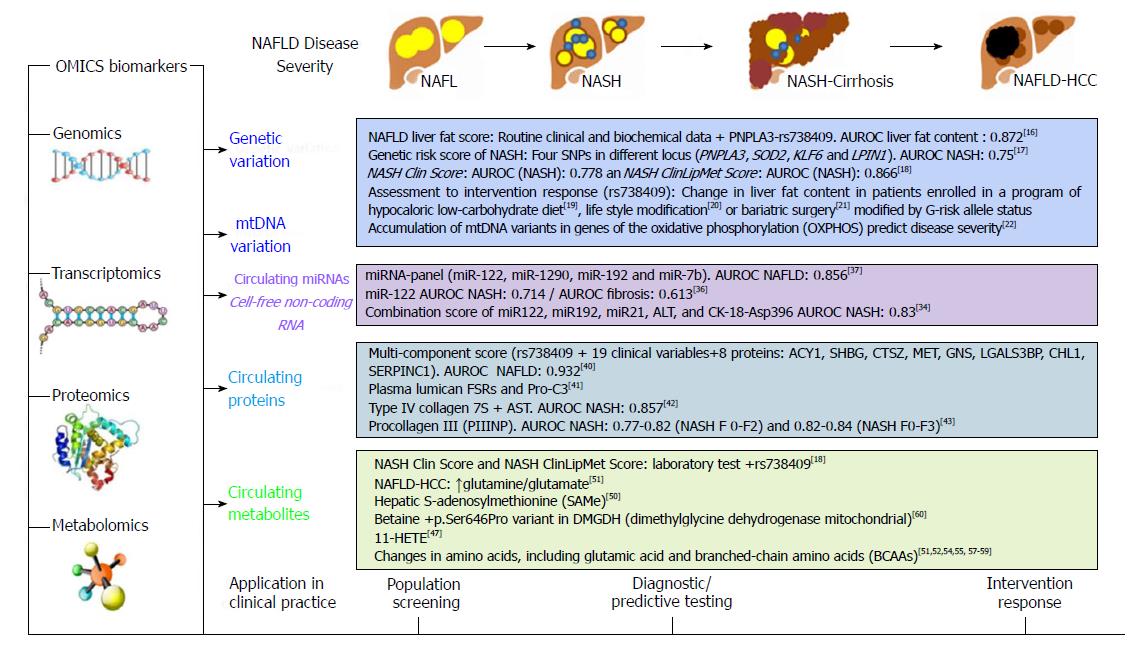
Figure 2 Summary of OMICs biomarkers in the prediction of nonalcoholic fatty liver disease severity.
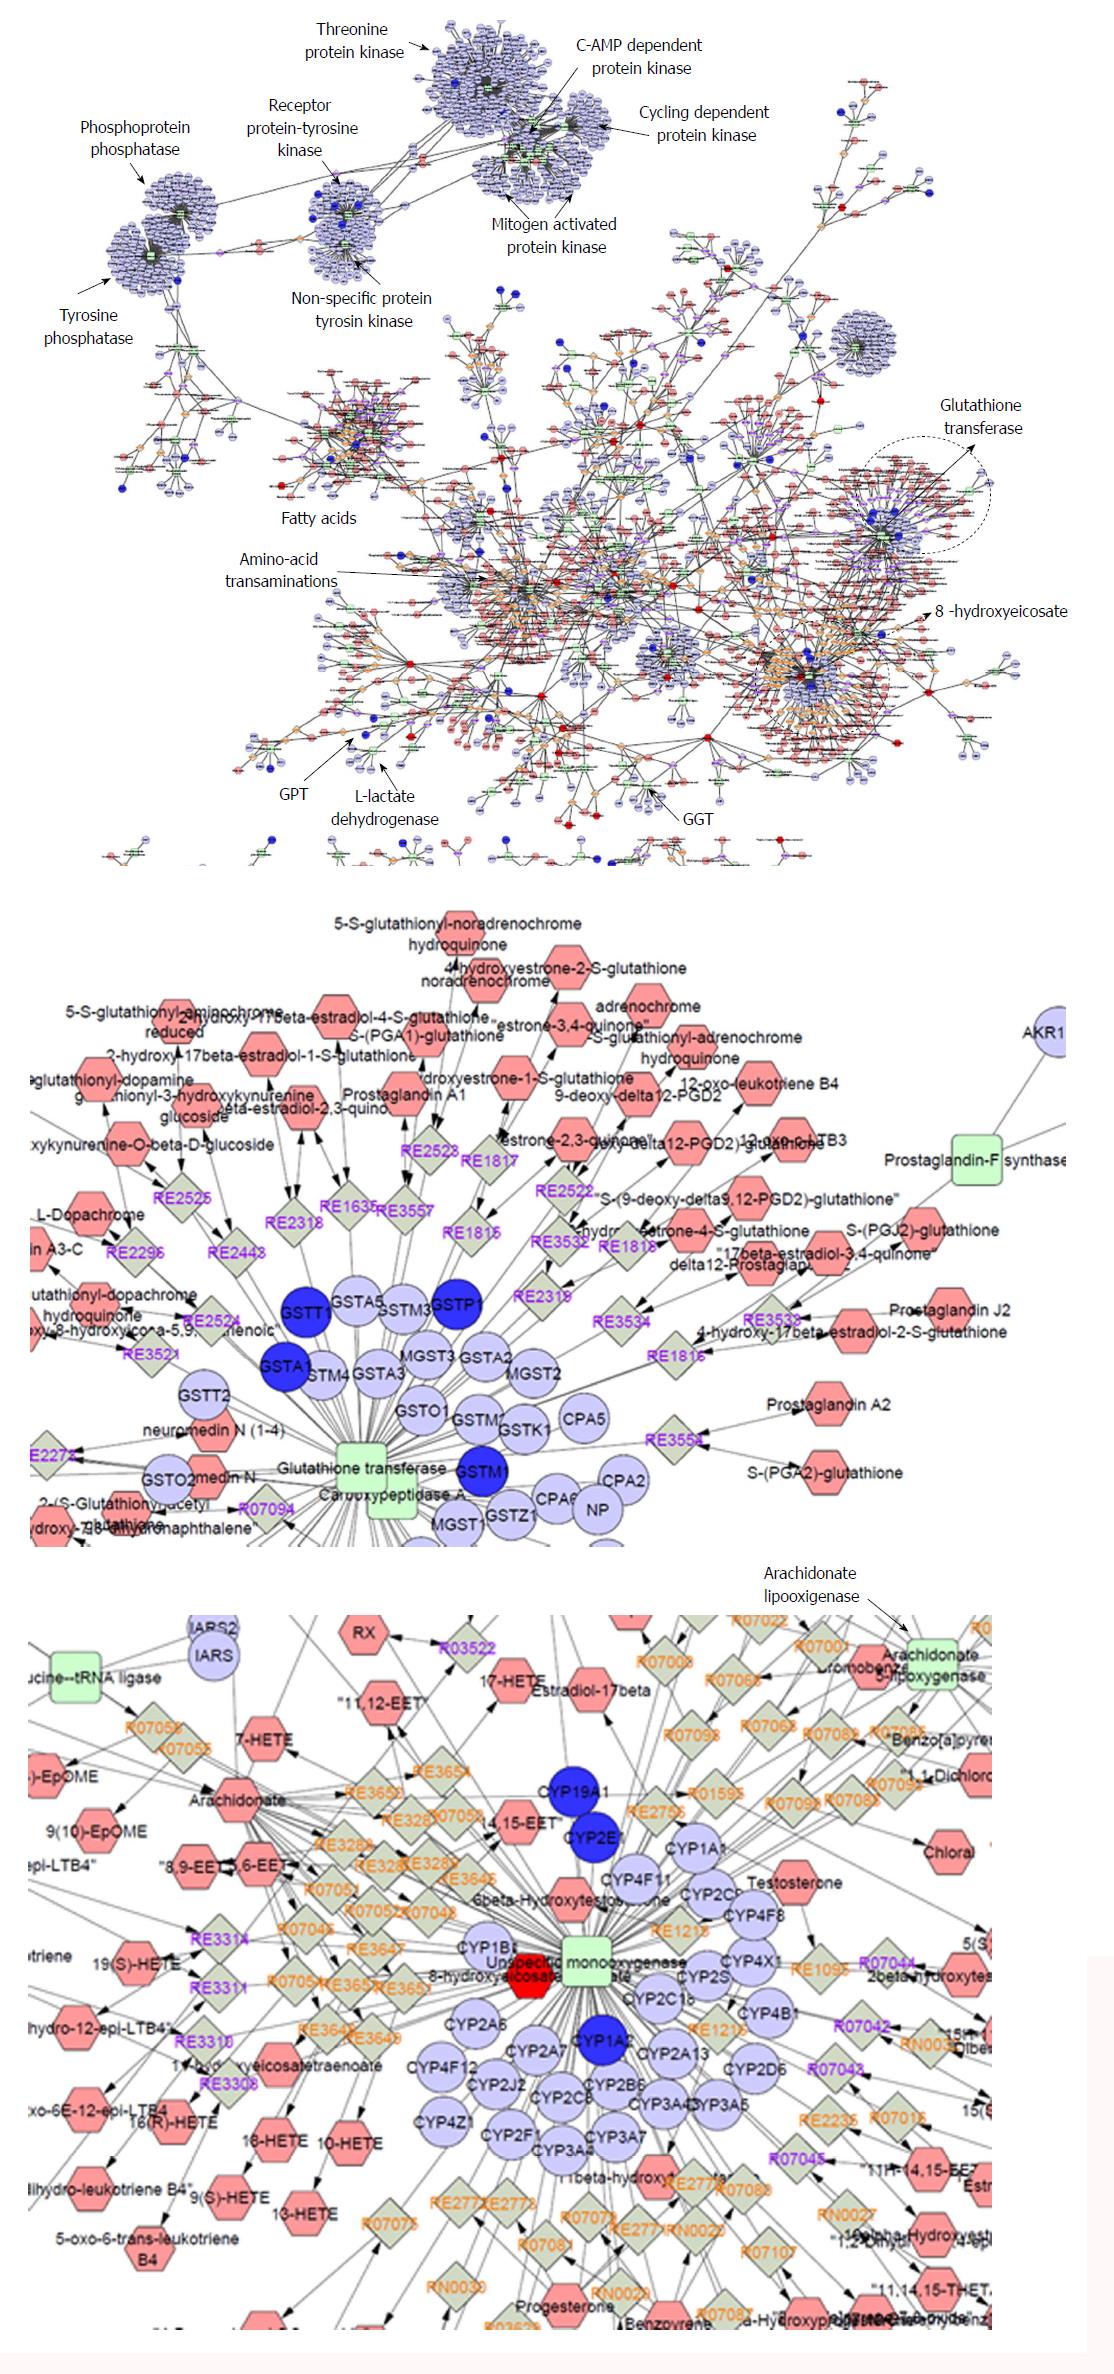
Figure 3 Whole interactome of compounds (hexagons), chemical reactions (diamonds), enzymes (squares) and genes (circles) associated with nonalcoholic fatty liver disease.
Details on the set of genes and metabolites that were included in the analysis can be found in the main text; terms were filtered according to the ones already found in the databases. The interactome was built using Metscape[73], a plug-in for the widely used network analysis software Cytoscape[74] that supports calculation, analysis and visualization of gene-to-metabolite networks in the context of metabolism.
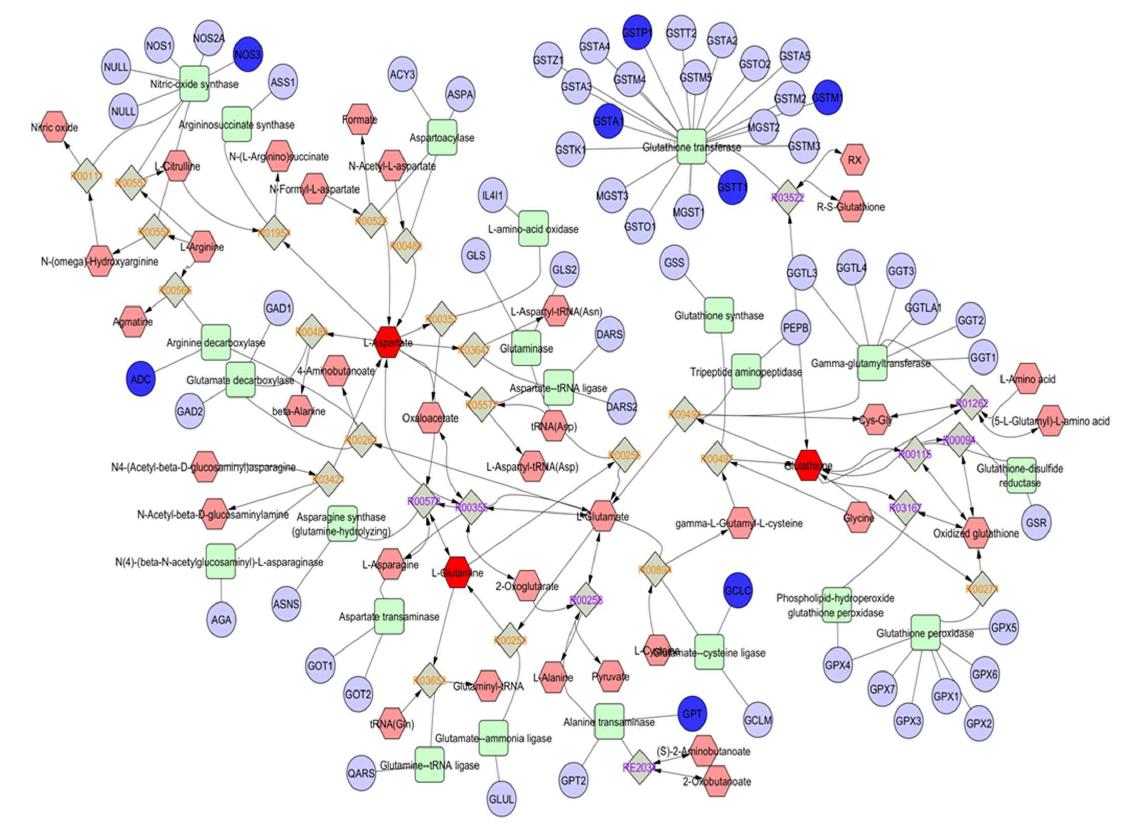
Figure 4 The urea-cycle, glutamate, and branched-chain amino acids in the biology of nonalcoholic fatty liver disease.
Sub-network analysis showing the urea-cycle and metabolism of amino acids (L-arginine, L-proline, L-glutamate, L-aspartate and L-asparagine) that were extracted from the interactome shown in Figure 3. Compounds (common names in the Human Metabolome Database, http://www.hmdb.ca), chemical reactions, enzymes (KEGG database) and genes (HUGO symbols) are represented by hexagons, diamonds, squares and circles, respectively.
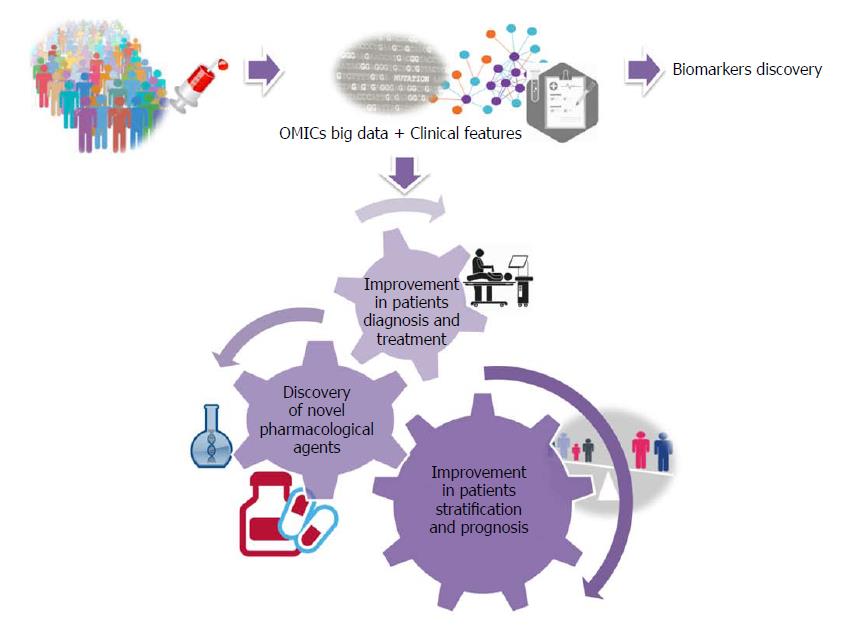
Figure 5 What to expect for the near future.
A personalized nonalcoholic fatty liver disease approach by integrating OMICs big data with clinical information.
- Citation: Pirola CJ, Sookoian S. Multiomics biomarkers for the prediction of nonalcoholic fatty liver disease severity. World J Gastroenterol 2018; 24(15): 1601-1615
- URL: https://www.wjgnet.com/1007-9327/full/v24/i15/1601.htm
- DOI: https://dx.doi.org/10.3748/wjg.v24.i15.1601


