Copyright
©The Author(s) 2018.
World J Gastroenterol. Apr 7, 2018; 24(13): 1486-1490
Published online Apr 7, 2018. doi: 10.3748/wjg.v24.i13.1486
Published online Apr 7, 2018. doi: 10.3748/wjg.v24.i13.1486
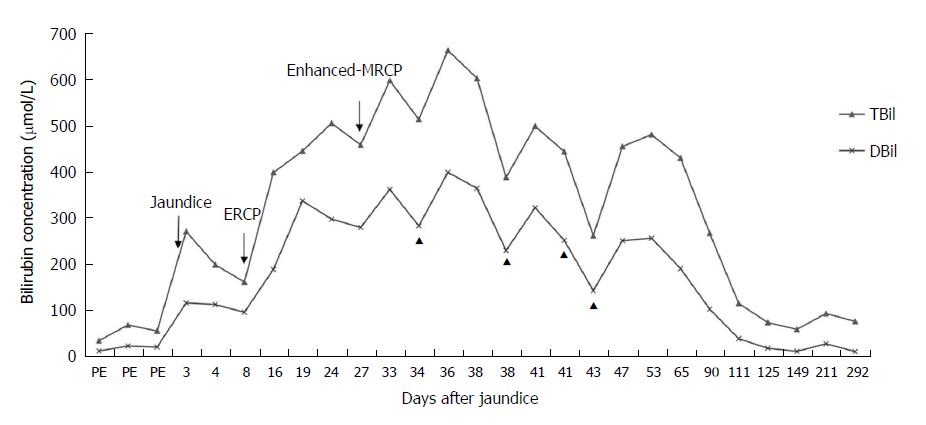
Figure 1 Bilirubin course from onset until the end of follow up.
DBil: Direct bilirubin; ERCP: Endoscopic retrograde cholangiopancreatography; MRCP: Magnetic resonance cholangiopancreatography; TBil: Total bilirubin; ▲ : After bilirubin adsorption treatment.
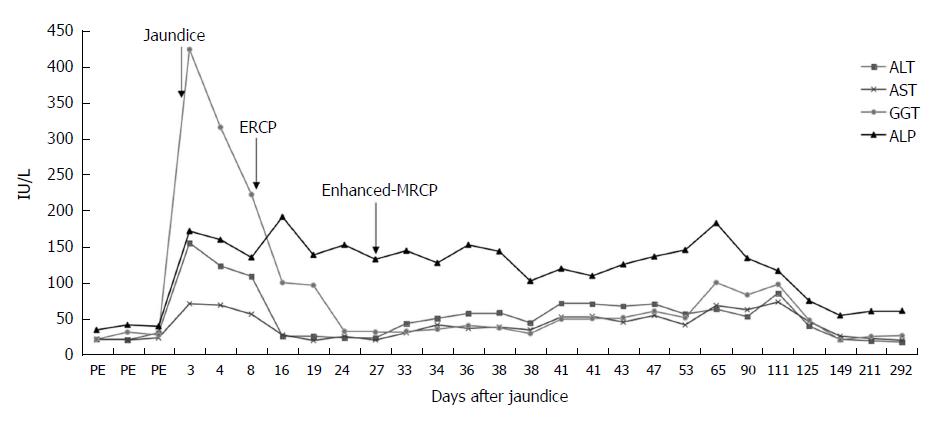
Figure 2 Liver enzyme concentrations from onset until the end of follow up.
ALT: Alanine aminotransferase; ALP: Alkaline phosphatase; AST: Aspartate aminotransferase; GGT: Gamma-glutamyl transpeptidase.
Figure 3 Cholestasis of liver tissue (hematoxylin-eosin stain, original magnification × 4).
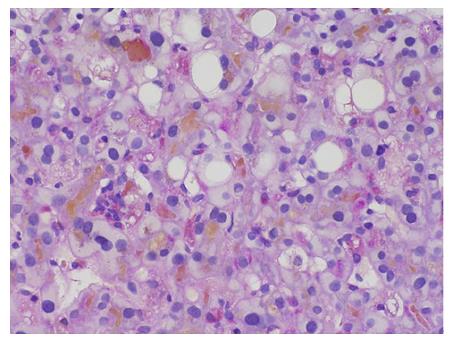
Figure 4 Liver lobular capillary bile duct cholestasis, slight inflammation, undamaged hepatocytes, and some ground-glass cytoplasm degeneration (D-PAS stain, original magnification × 60).
- Citation: Qian JD, Hou FQ, Wang TL, Shao C, Wang GQ. Gilbert syndrome combined with prolonged jaundice caused by contrast agent: Case report. World J Gastroenterol 2018; 24(13): 1486-1490
- URL: https://www.wjgnet.com/1007-9327/full/v24/i13/1486.htm
- DOI: https://dx.doi.org/10.3748/wjg.v24.i13.1486


