Copyright
©The Author(s) 2018.
World J Gastroenterol. Apr 7, 2018; 24(13): 1440-1450
Published online Apr 7, 2018. doi: 10.3748/wjg.v24.i13.1440
Published online Apr 7, 2018. doi: 10.3748/wjg.v24.i13.1440
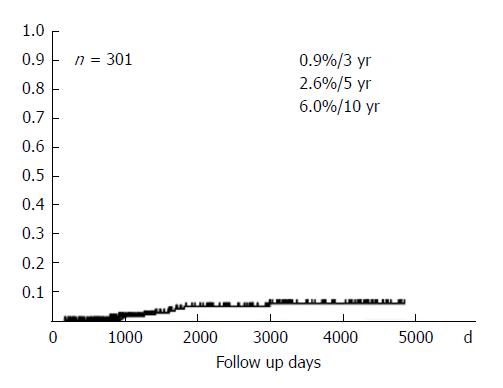
Figure 1 Cumulative incidence rate of hepatocellular carcinoma by Kaplan Meier analysis.
The horizontal and vertical axes show days from liver biopsy and cumulative incidence rate of hepatocellular carcinoma, respectively.
Figure 2 Comparison of incidence rates of hepatocellular carcinoma between mild drinking and non-drinking groups.
The vertical axis shows incidence rate (percentage) of hepatocellular carcinoma during follow-up time.
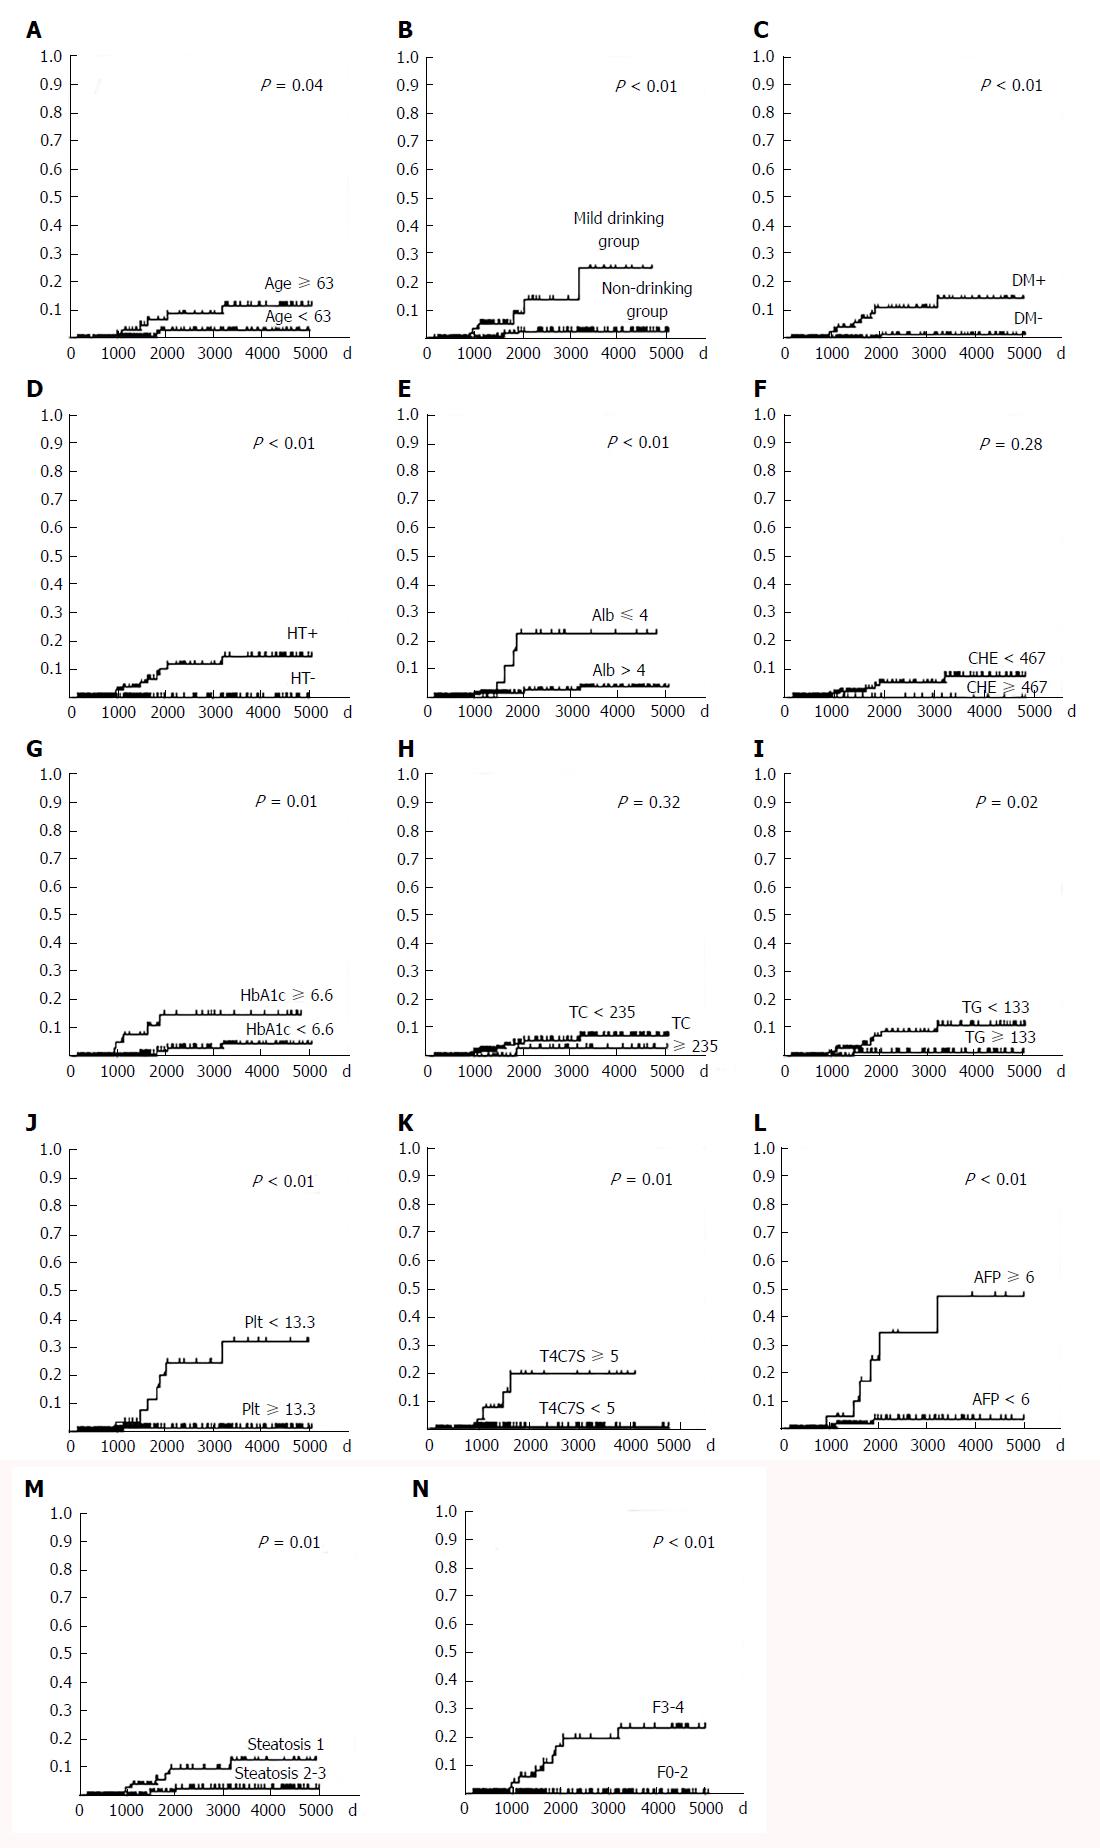
Figure 3 Cumulative incidence rate of hepatocellular carcinoma based on data at the time of liver biopsy.
A: Age; B: Drinking habit; C: Diabetes mellitus; D: Hypertension; E: Albumin; F: Cholinesterase; G: HbA1c, H: Total cholesterol; I: Triglyceride; J: Platelet; K: Type IV collagen 7S; L: Alpha-fetoprotein; M: Steatosis; N: Fibrosis. The horizontal and vertical axes show days from liver biopsy and cumulative incidence rate of hepatocellular carcinoma, respectively. DM: Diabetes mellitus; HT: Hypertension; Alb: Albumin; CHE: Cholinesterase; TC: Total cholesterol; TG: Triglyceride; Plt: Platelet; T4C7S: Type IV collagen 7S; AFP: Alpha-fetoprotein; F: Fibrosis.
- Citation: Kimura T, Tanaka N, Fujimori N, Sugiura A, Yamazaki T, Joshita S, Komatsu M, Umemura T, Matsumoto A, Tanaka E. Mild drinking habit is a risk factor for hepatocarcinogenesis in non-alcoholic fatty liver disease with advanced fibrosis. World J Gastroenterol 2018; 24(13): 1440-1450
- URL: https://www.wjgnet.com/1007-9327/full/v24/i13/1440.htm
- DOI: https://dx.doi.org/10.3748/wjg.v24.i13.1440


