Copyright
©The Author(s) 2018.
World J Gastroenterol. Mar 21, 2018; 24(11): 1228-1238
Published online Mar 21, 2018. doi: 10.3748/wjg.v24.i11.1228
Published online Mar 21, 2018. doi: 10.3748/wjg.v24.i11.1228
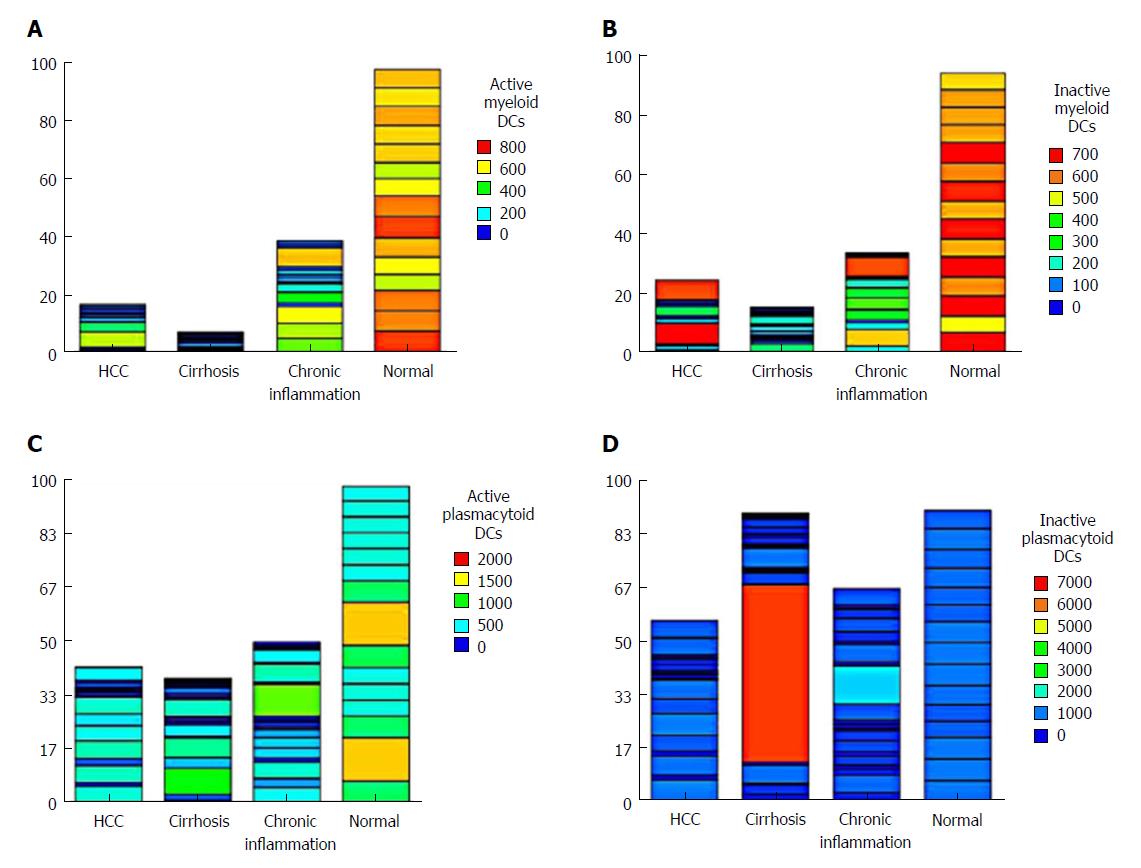
Figure 1 Heatmap of the differential levels of (A) active myeloid dendritic cells, (B) inactive myeloid dendritic cells, (C) active plasmacytoid cells, and (D) inactive plasmacytoid cells in the four groups studied.
HCC: Hepatocellular carcinoma.
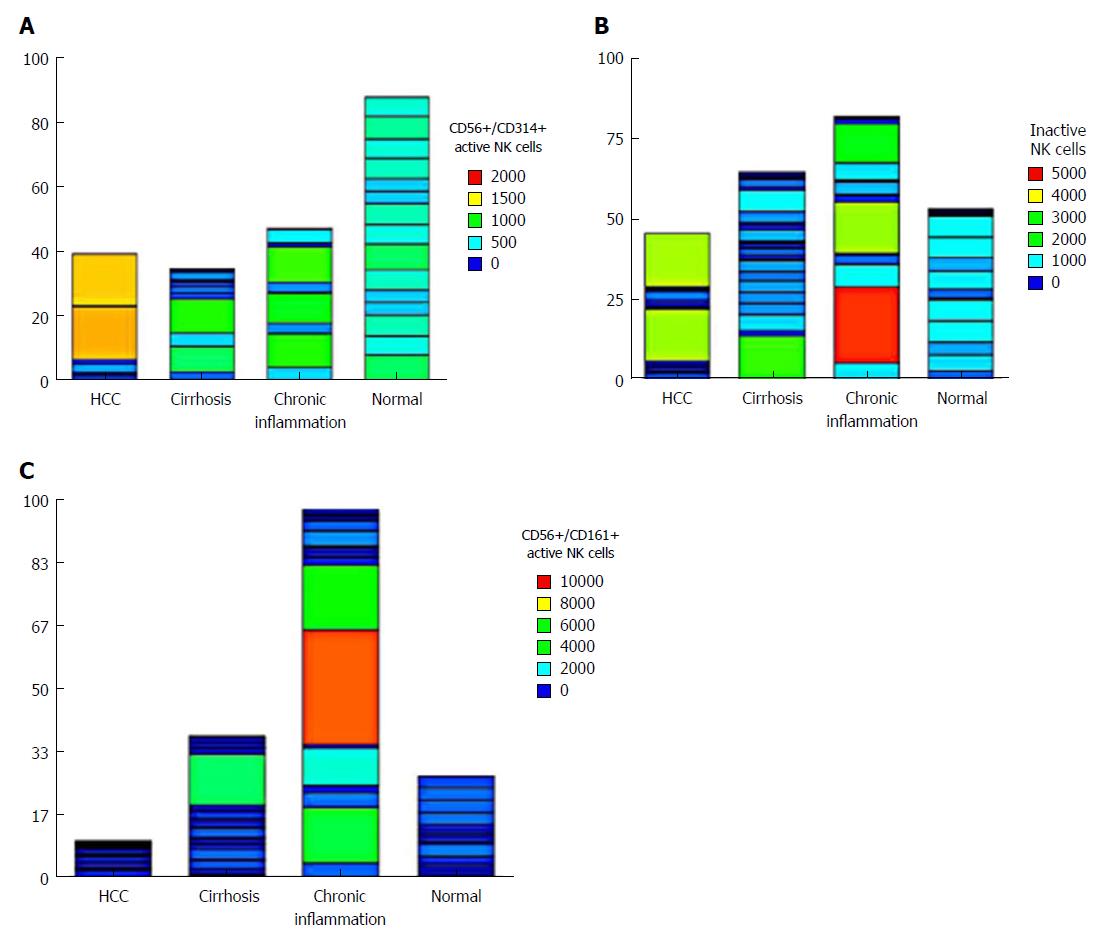
Figure 2 Heatmap of the differential levels of (A) active natural killer cells (CD56+/CD314+), (B) inactive natural killer cells (CD56+/CD158+), and (C) natural killer cells (CD56+/CD161+) in the four groups studied.
HCC: Hepatocellular carcinoma.
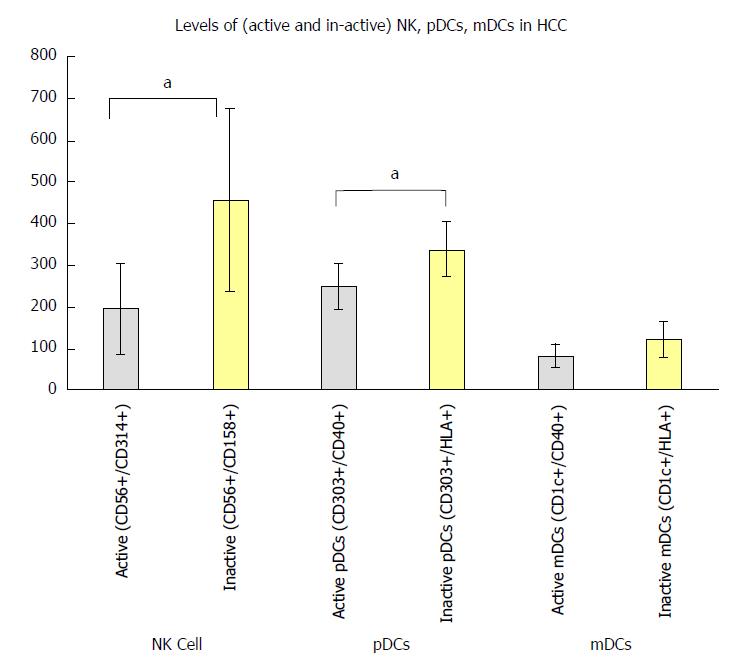
Figure 3 Balance between active and inactive natural killer cells, plasmacytoid cells, and myeloid dendritic cells in hepatocellular carcinoma patients in relation to the normal group.
aP < 0.05. HCC: Hepatocellular carcinoma; mDCs: Myeloid dendritic cells; NK: Natural killer; pDCs: Plasmacytoid cells.
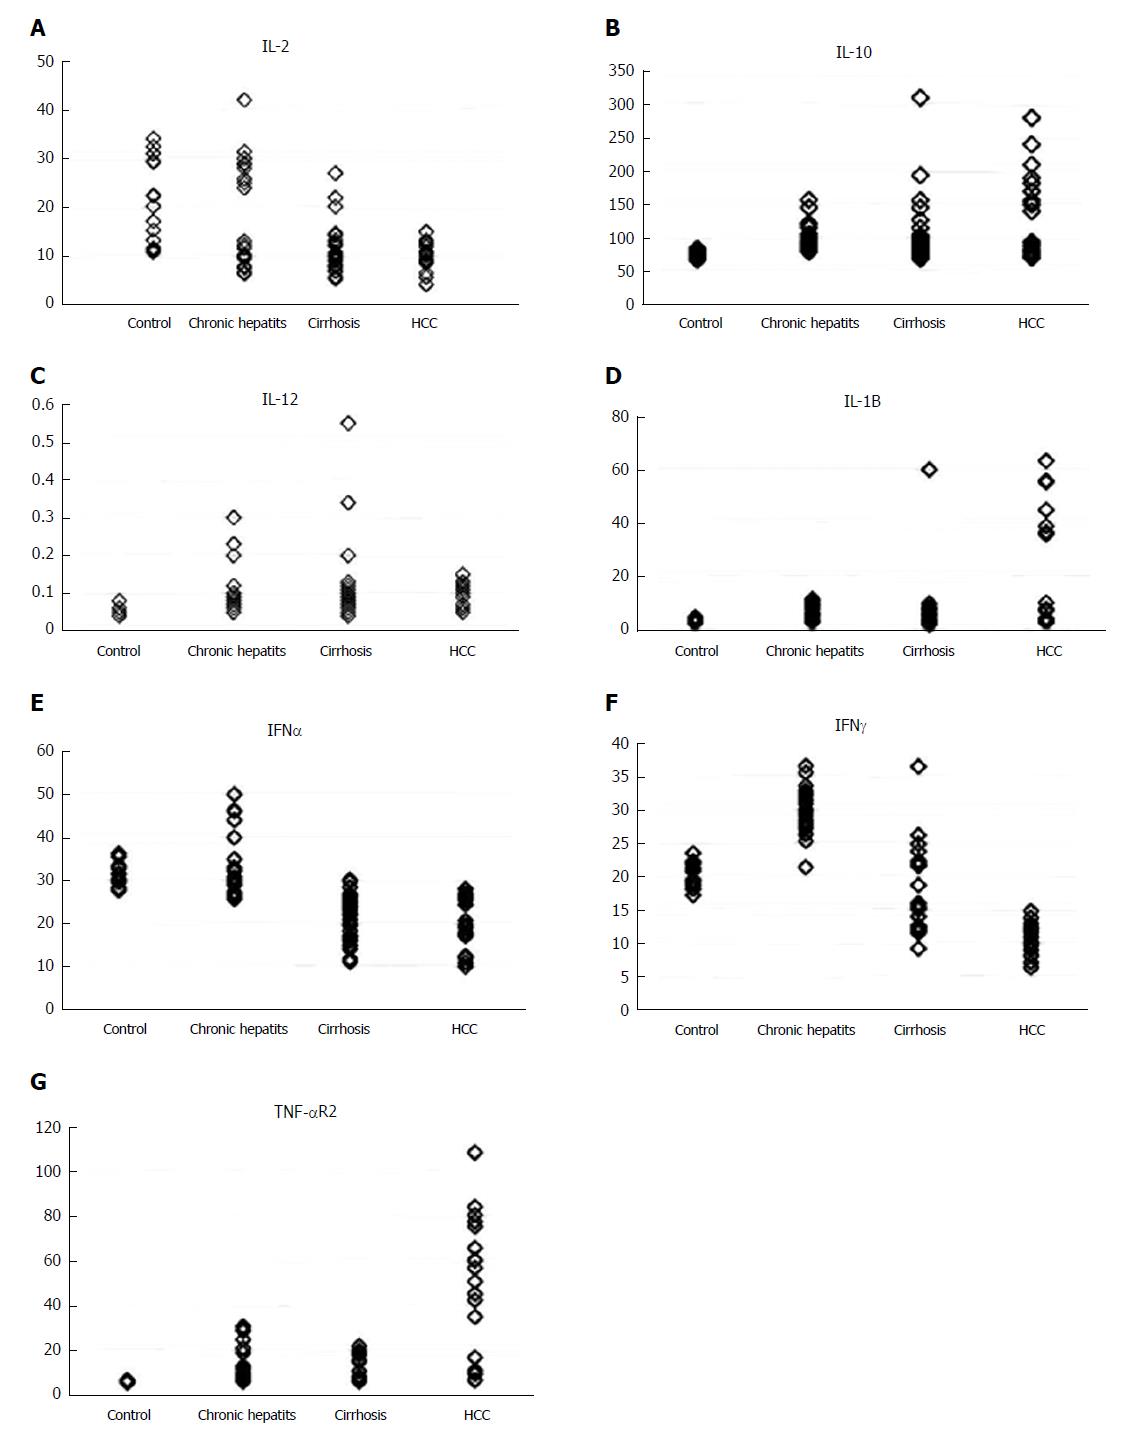
Figure 4 Different levels of serum cytokines in the four groups studied.
A: IL-2; B: IL-10; C: IL-12; D: IL-1Β; E: IFN-α; F: IFN-γ; G: TNF-αR2. IFN: Interferon; IL: Interleukin; TNF: Tumor necrosis factor.
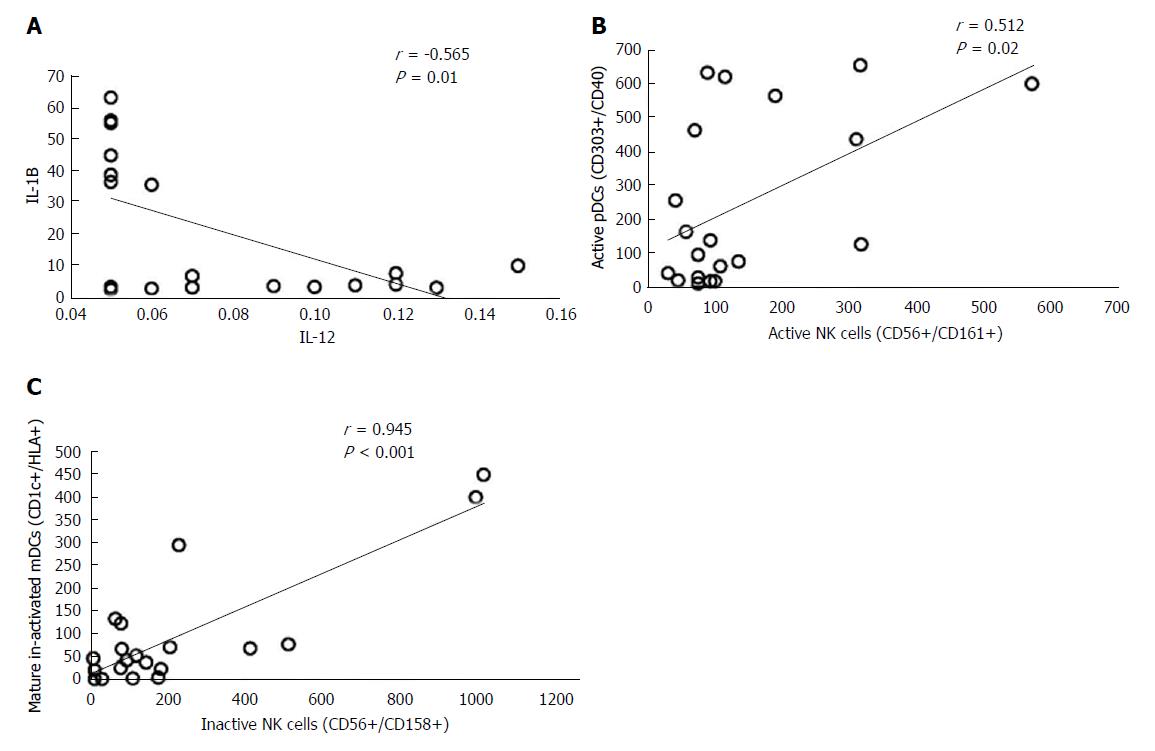
Figure 5 Correlation between immune cells and cytokine levels in hepatocellular carcinoma patients.
IL: Interleukin; NK: Natural killer.
- Citation: Zekri ARN, El Deeb S, Bahnassy AA, Badr AM, Abdellateif MS, Esmat G, Salama H, Mohanad M, El-dien AE, Rabah S, Abd Elkader A. Role of relevant immune-modulators and cytokines in hepatocellular carcinoma and premalignant hepatic lesions. World J Gastroenterol 2018; 24(11): 1228-1238
- URL: https://www.wjgnet.com/1007-9327/full/v24/i11/1228.htm
- DOI: https://dx.doi.org/10.3748/wjg.v24.i11.1228


