Copyright
©The Author(s) 2018.
World J Gastroenterol. Mar 14, 2018; 24(10): 1084-1092
Published online Mar 14, 2018. doi: 10.3748/wjg.v24.i10.1084
Published online Mar 14, 2018. doi: 10.3748/wjg.v24.i10.1084
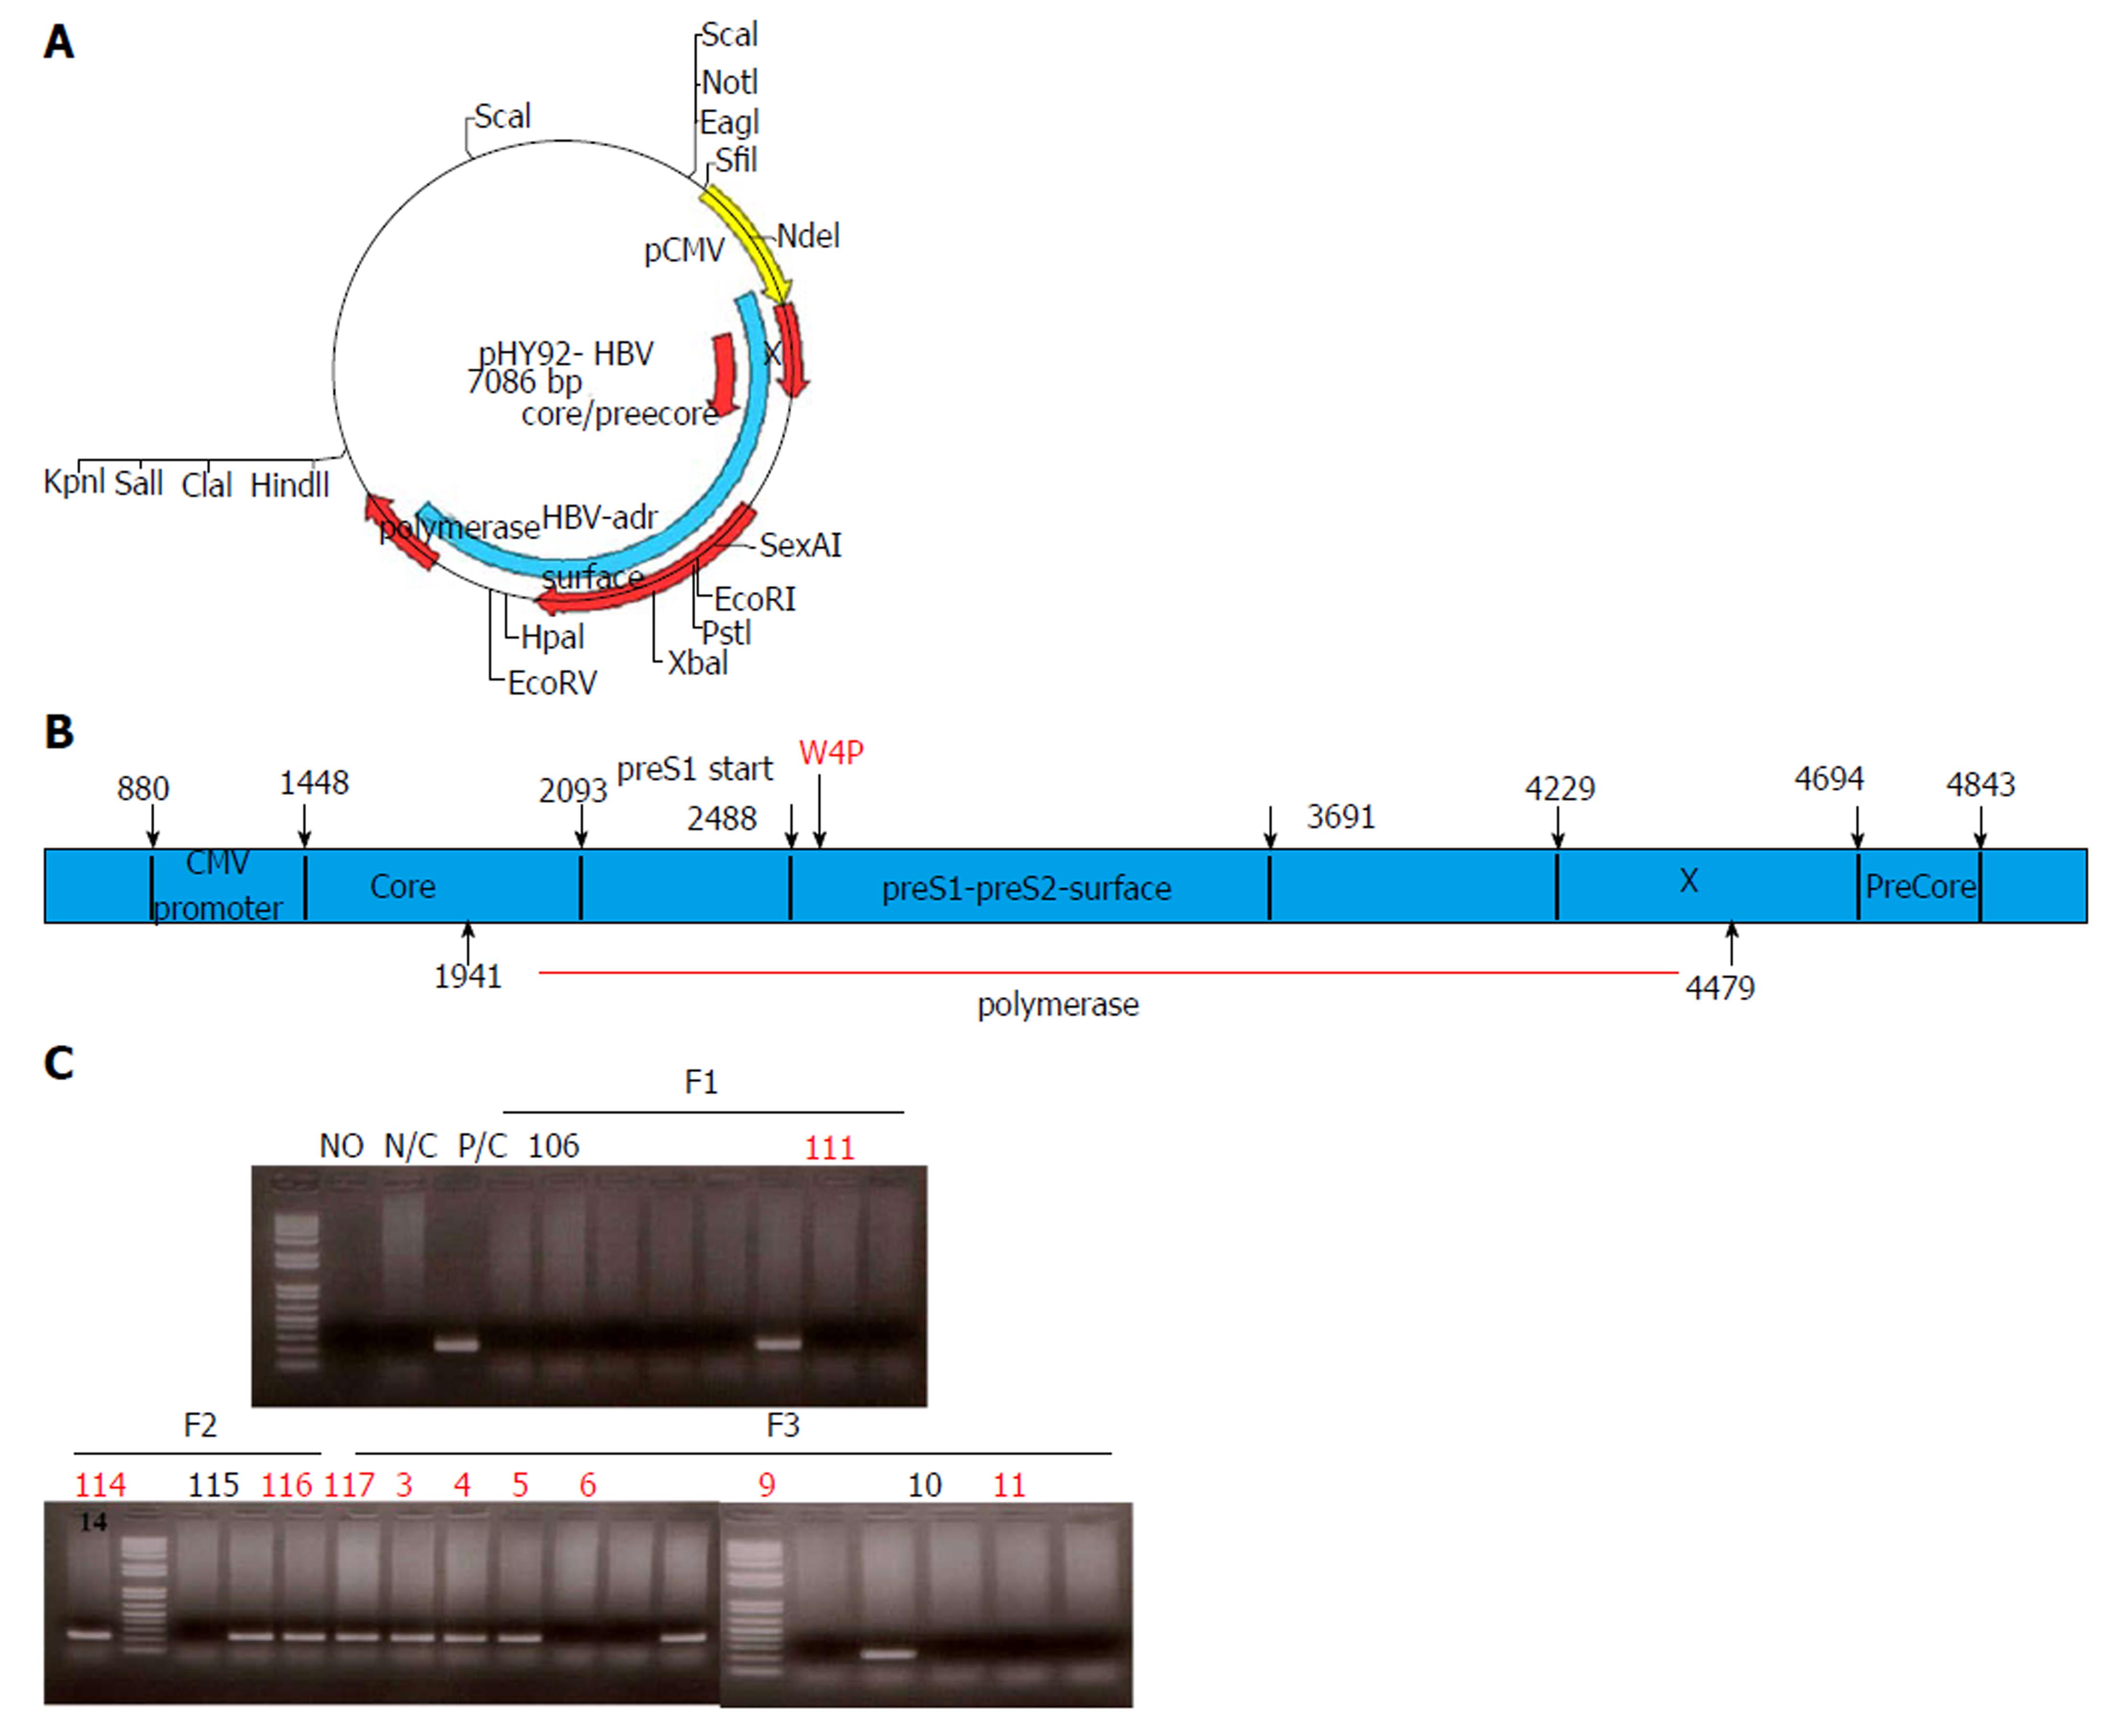
Figure 1 Construction of the W4P TG mice expressing pHY92-1.
1x the HBV full genome with the preS1 W4P mutation and the screening of the constructed W4P TG mice. A: A plasmid map of pHY92 vector containing a copy of the 1.1x-unit length HBV genome under the control of a CMV promoter; B: The HBV full genome construct with a W4P missense mutation in the preS1 region; C: Screening of the constructed W4P TG mice by PCR targeting the preS1 region. CMV: Cytomegalovirus; HBV: Hepatitis B virus.
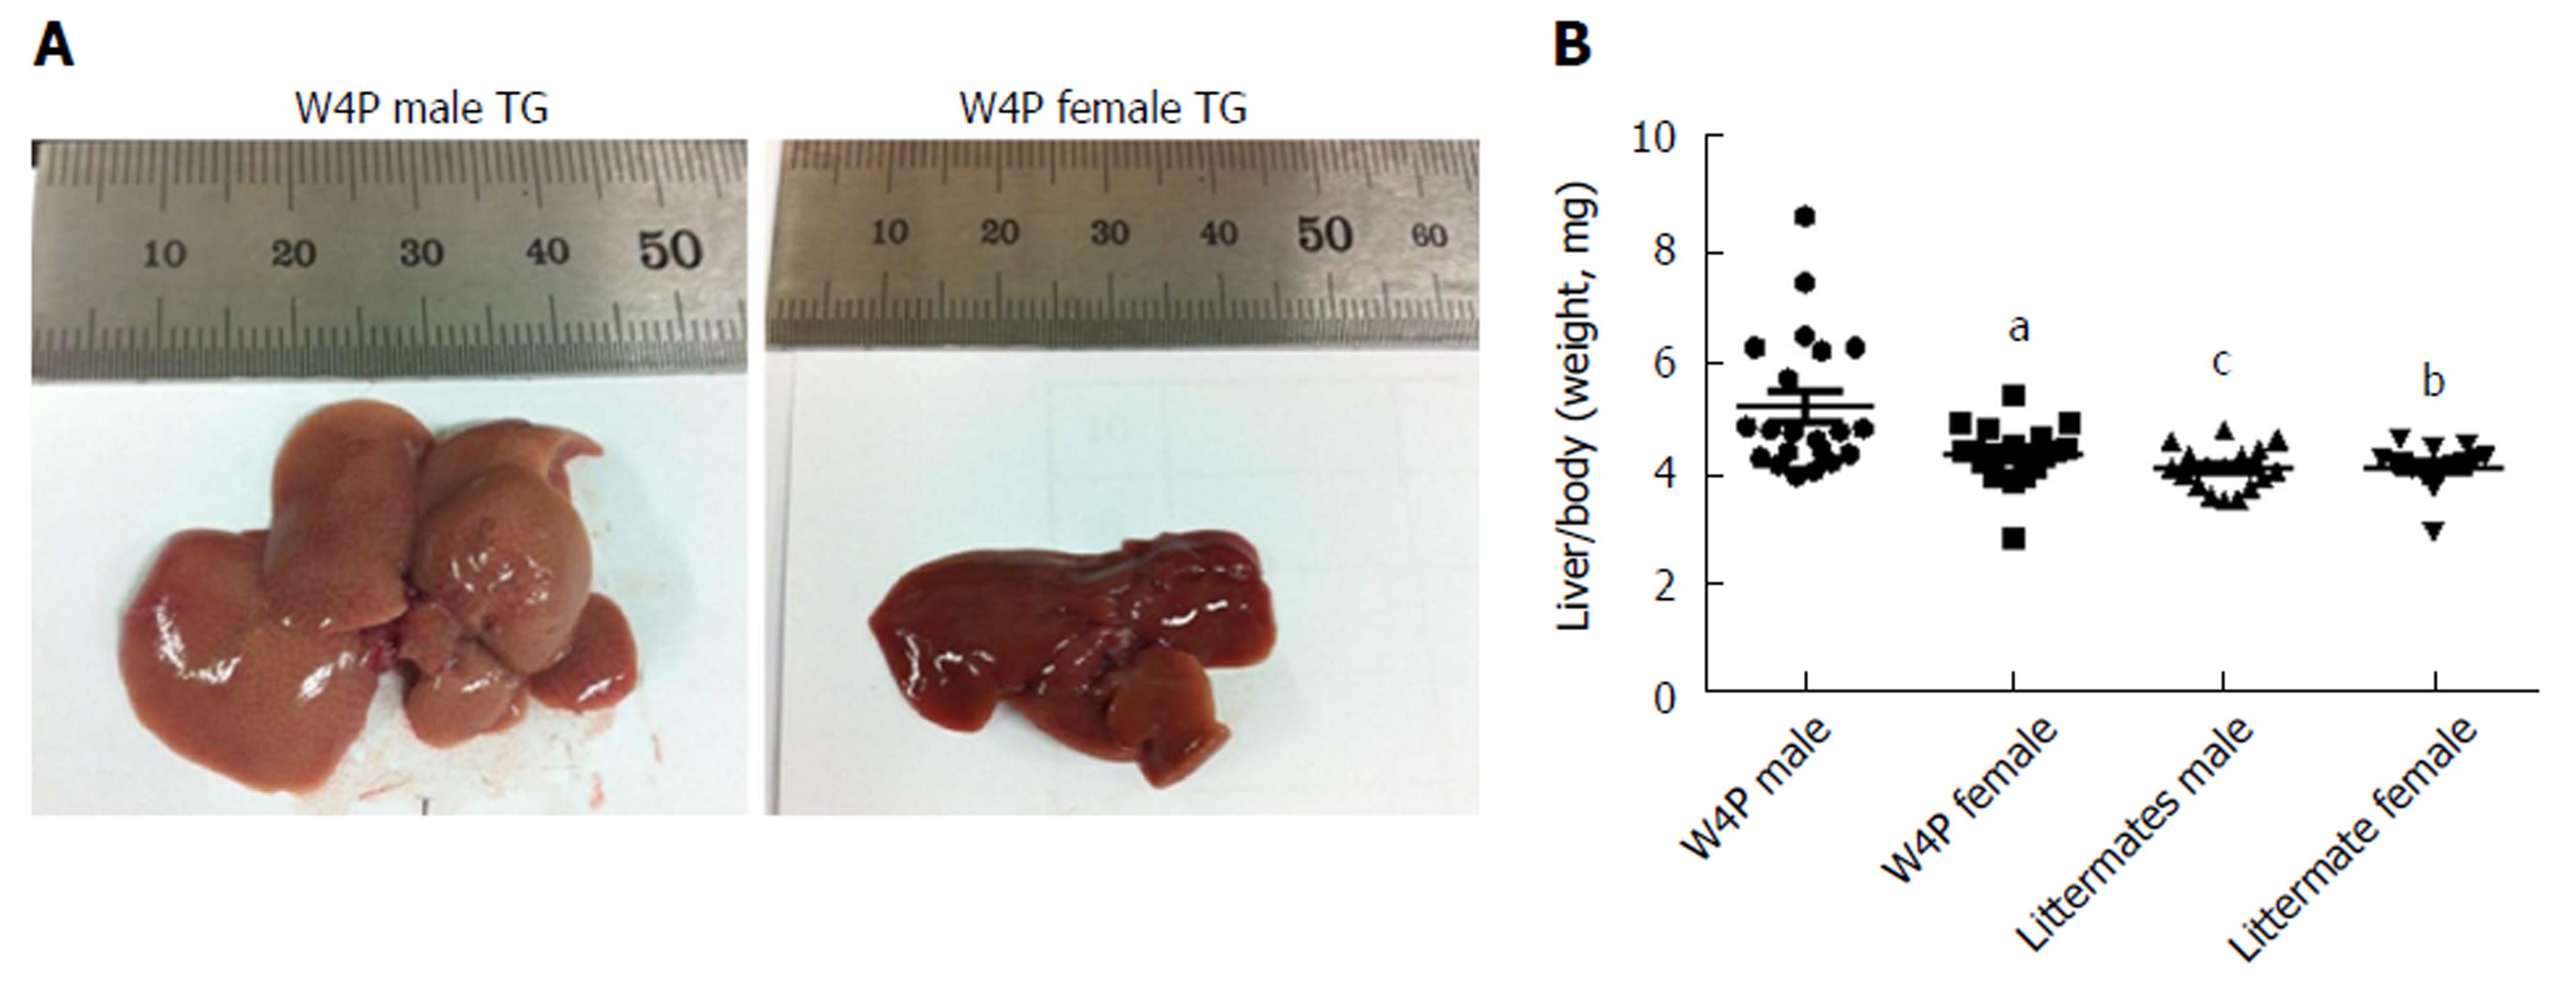
Figure 2 Increased hepatomegaly in the W4P male TG mice.
A: In situ view of liver of W4P TG male mice and W4P TG female mice at 10 mo of age; B: Liver weight ratio against the total body weight (mg) in W4P mutant mice (males: 24 mice; females: 18 mice) and nonTG littermates (males: 17 mice; females: 15 mice) at 10 mo of age (aP < 0.05, bP < 0.01, and cP < 0.001 vs W4P male, one-way ANOVA.
Figure 3 Increased generation of lipid droplets in W4P male TG mice.
A: Comparison of generated lipid droplets in the liver section by hematoxylin-eosin staining (× 200); B: Incidence of lipid droplets in W4P mutant mice (males: 24 mice; females: 18 mice) and non TG littermates (males: 17 mice; females: 15 mice) at 10 mo of age.
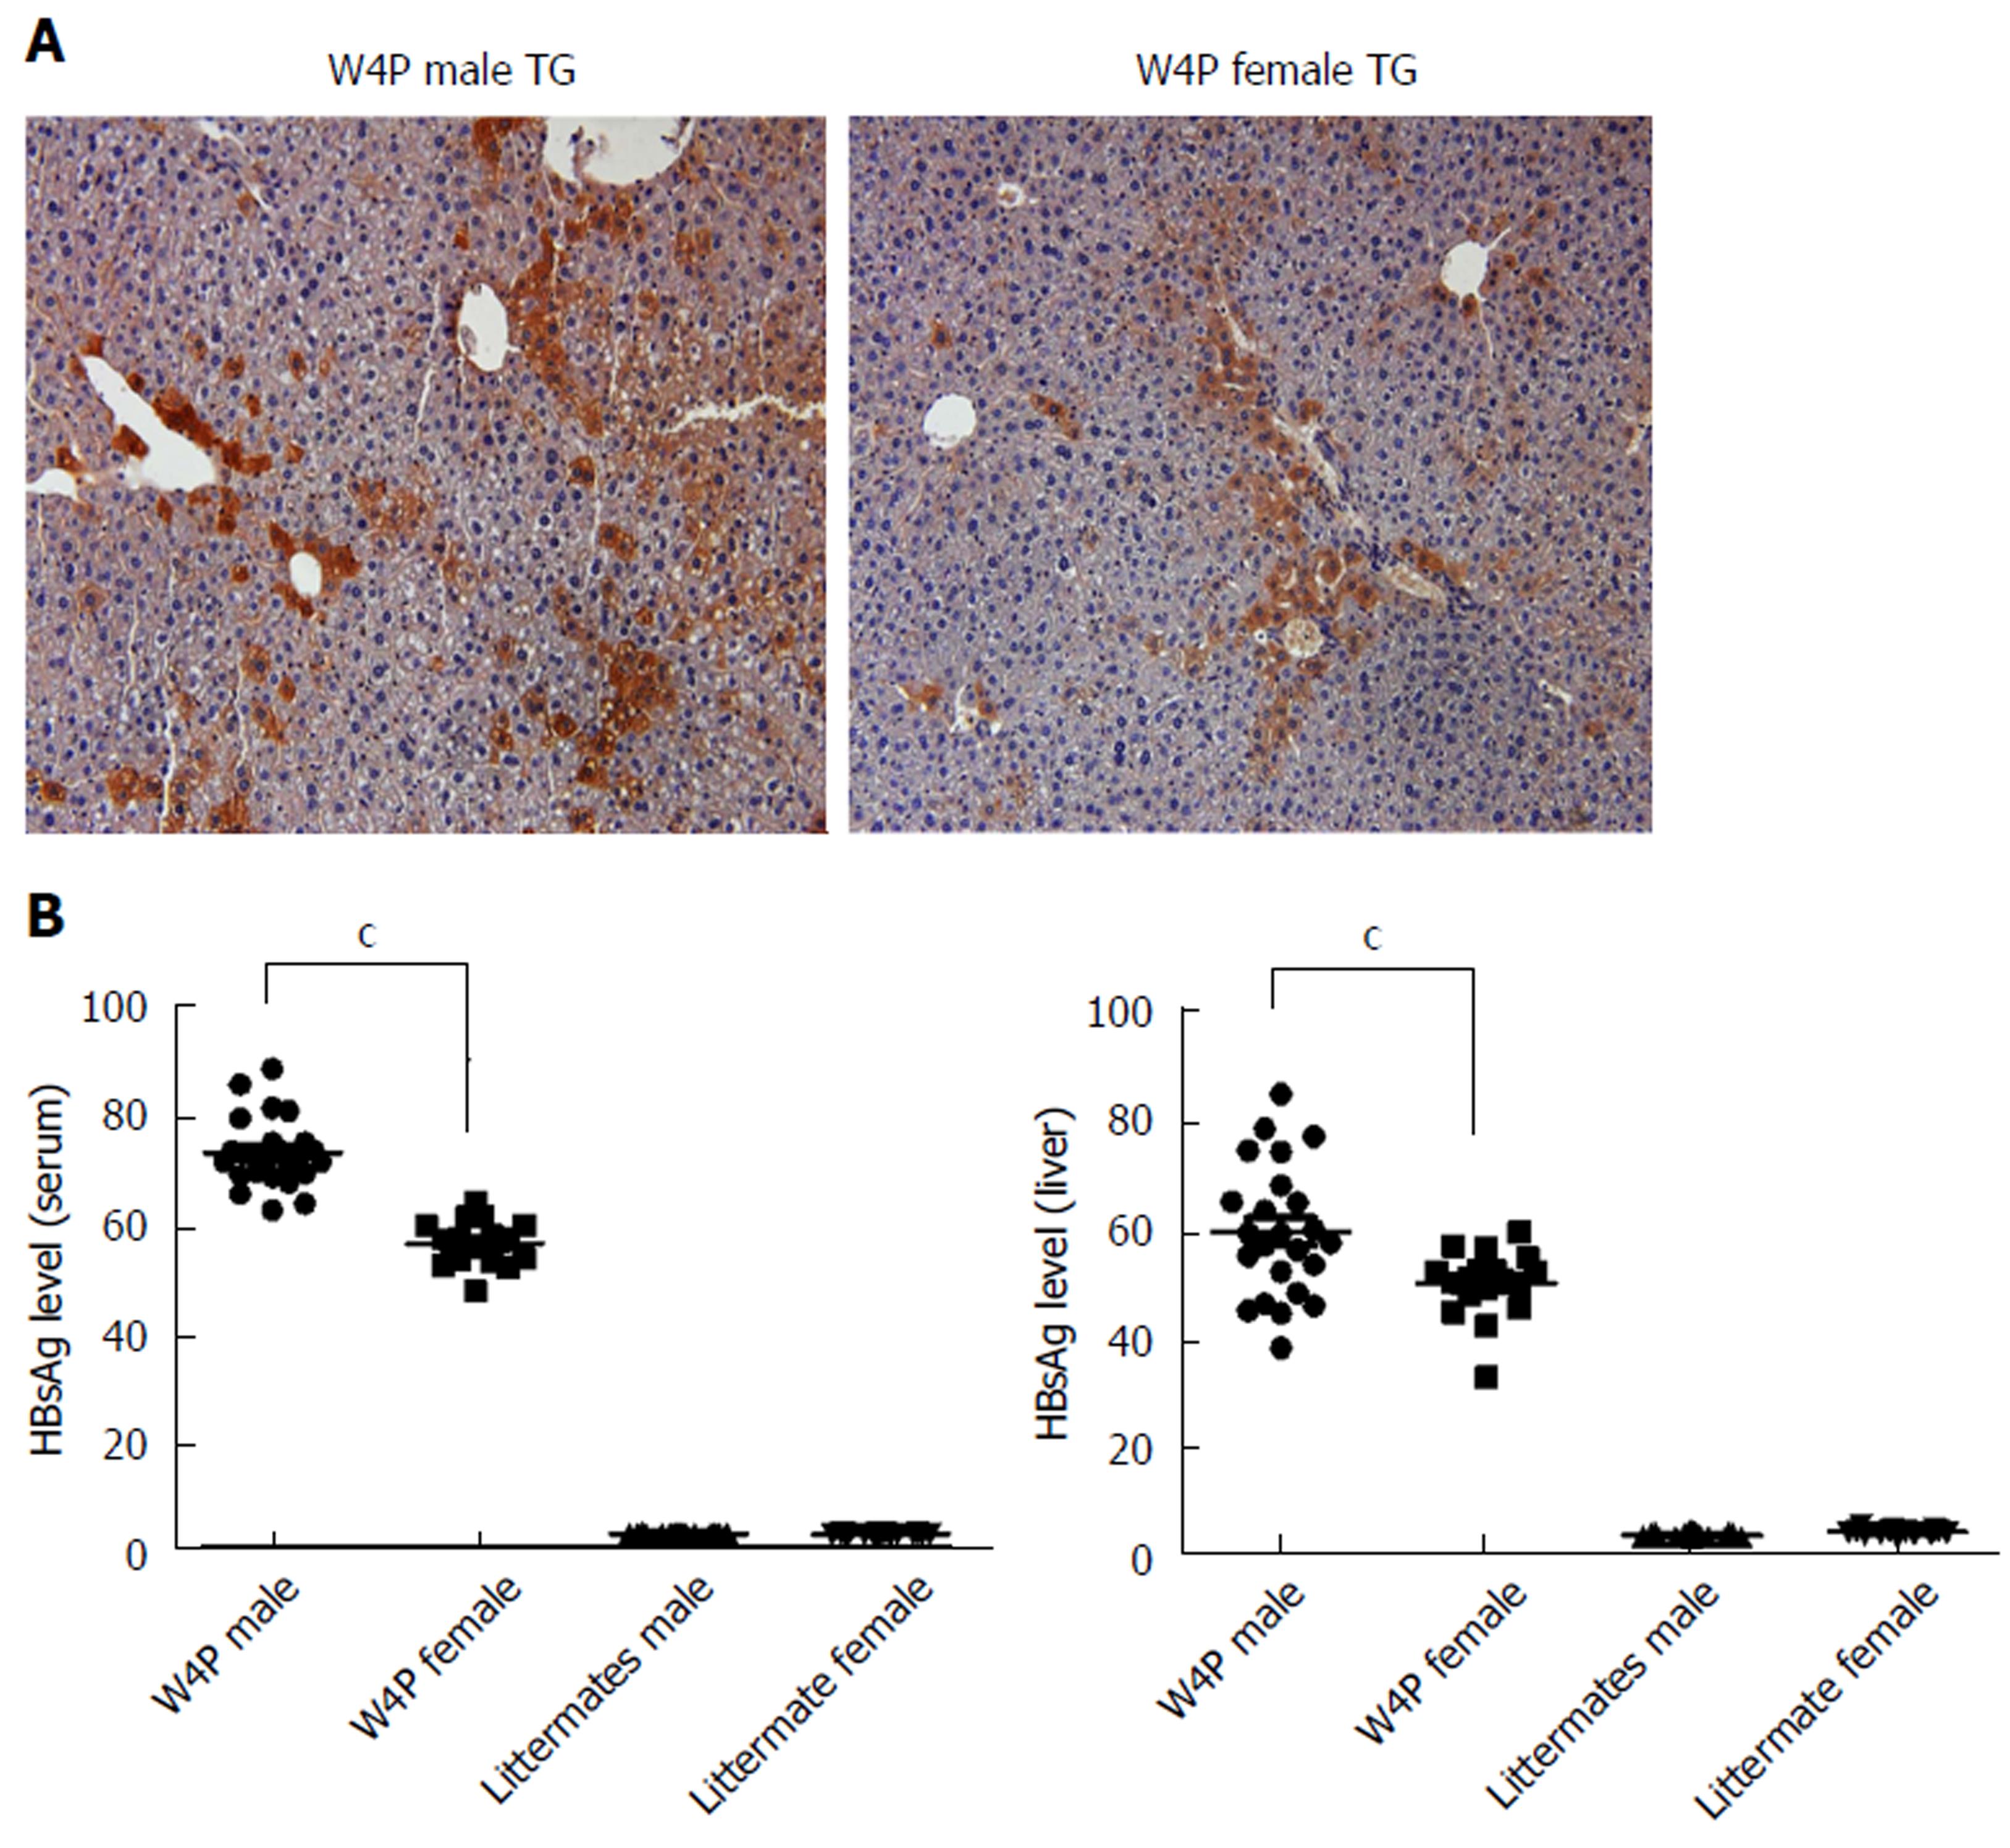
Figure 4 Increased secreted HBsAg level and liver LHBs in W4P male TG mice.
A: Comparison of LHBs level in liver section by IHC analysis using anti-preS1 antibodies between W4P TG male and female mice (× 200); B: Comparison of HBsAg level in the liver and serum from W4P mutant mice (males: 24 mice; females: 18 mice) and nonTG littermates (males: 17 mice; females: 15 mice) at 10 mo of age (cP < 0.001 vs W4P male, one-way ANOVA). HBsAg: Hepatitis B surface antigen; IHC: Immunohistochemistry; LHBs: Large-surface proteins.
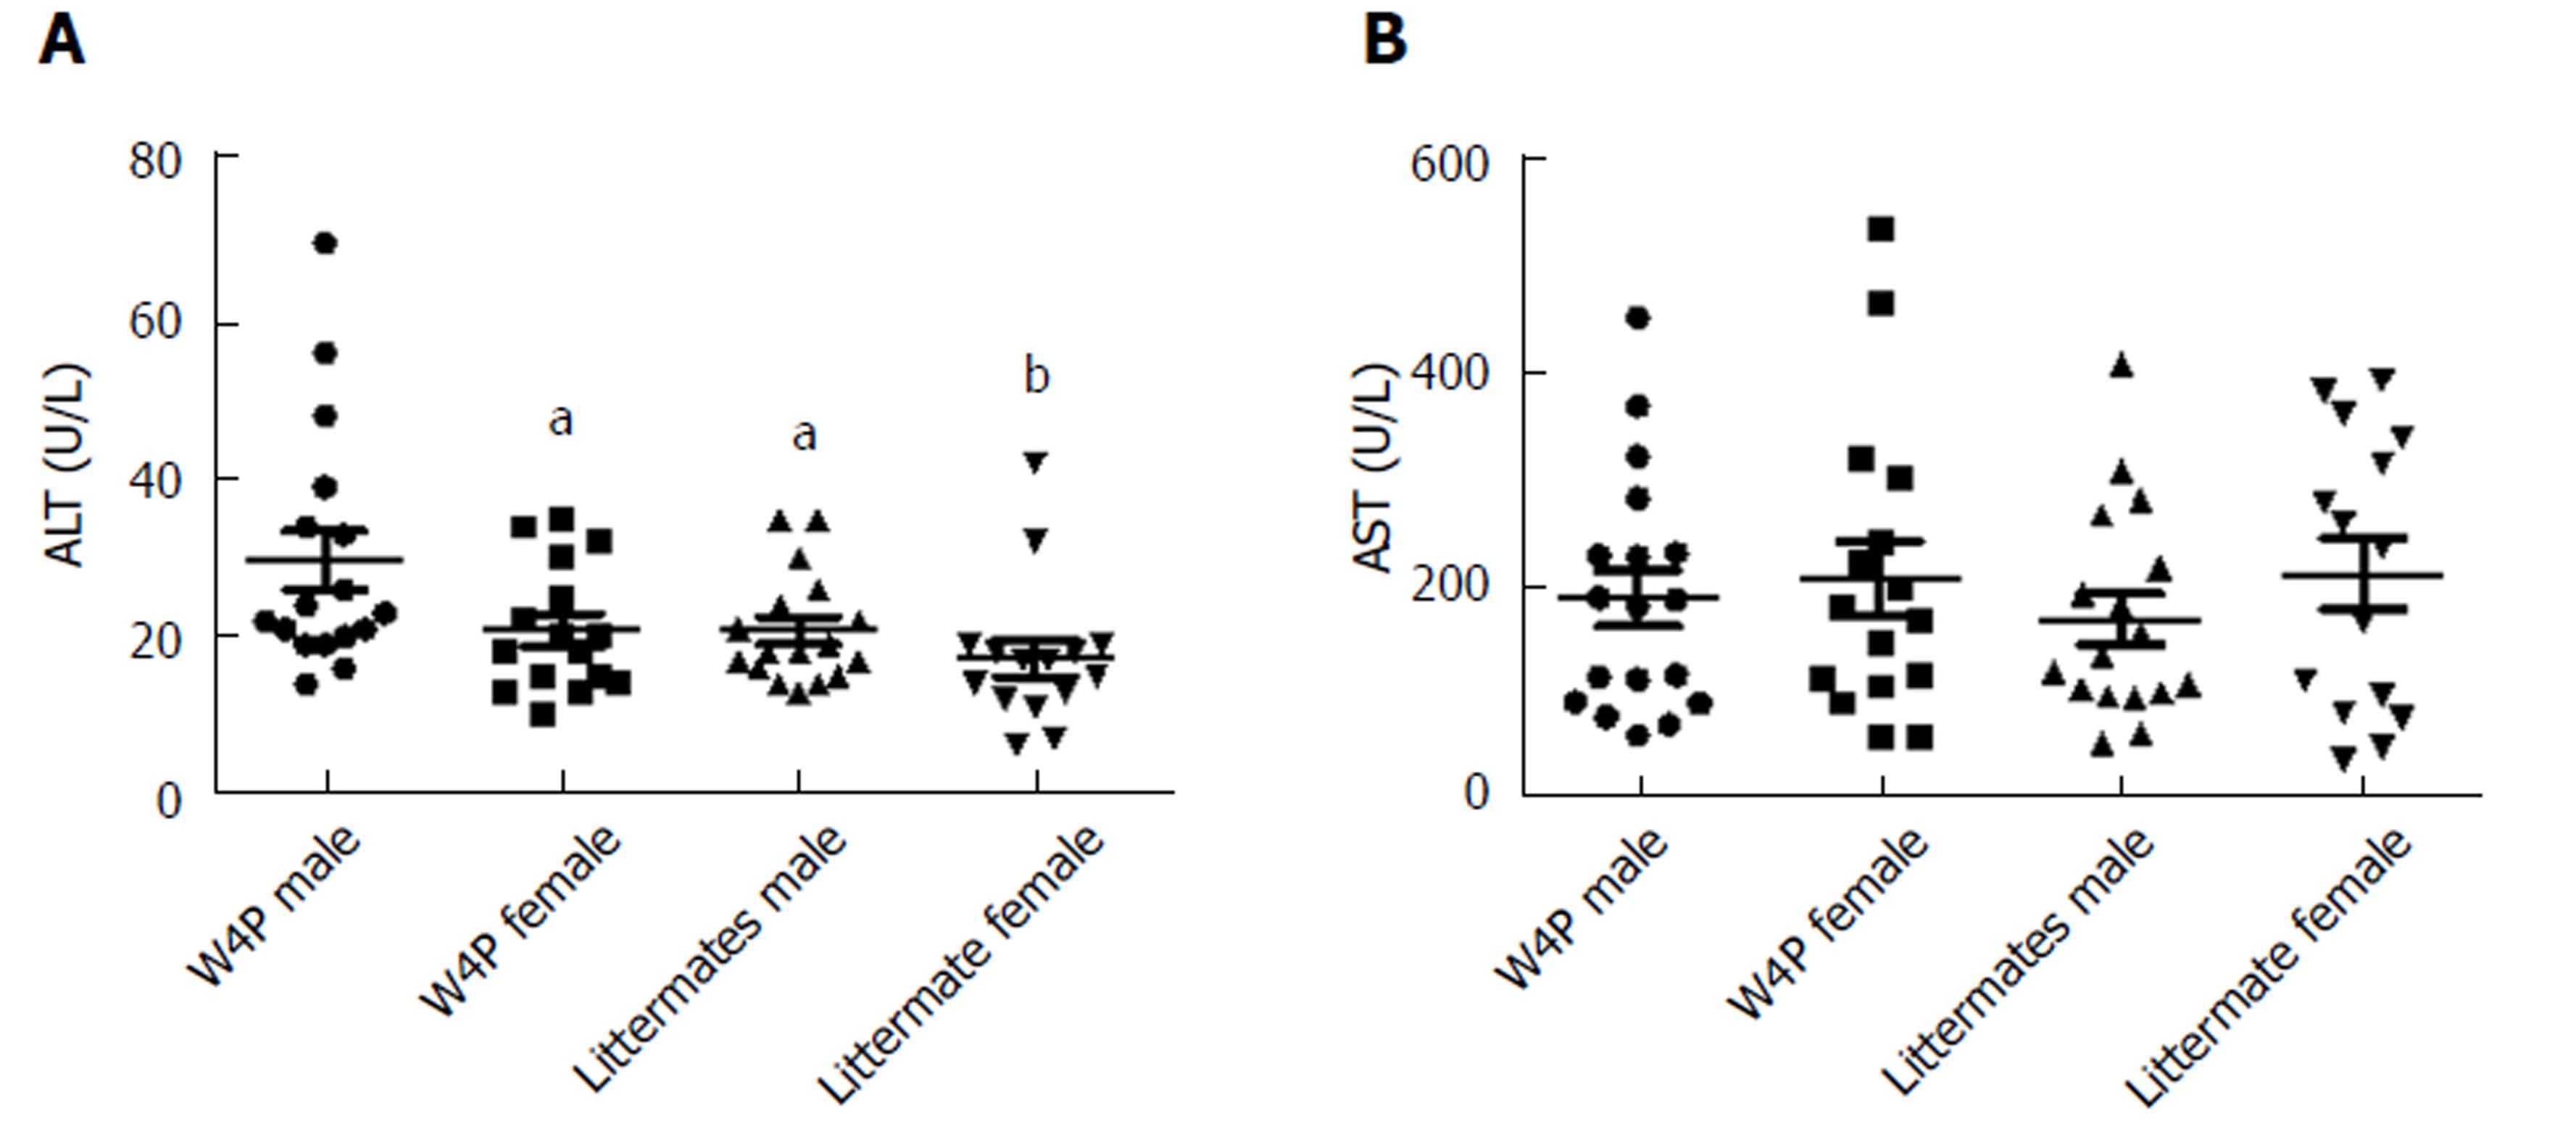
Figure 5 Serum alanine aminotransferase (A) and aspartate transaminase (B) levels in W4P TG mice (males: 24 mice; females: 18 mice) and nonTG littermates (males: 17 mice; females: 15 mice) at 10 mo of age.
aP < 0.05, and bP < 0.01, vs W4P male, one-way ANOVA. ALT: Alanine aminotransferase; AST: Aspartate transaminase.
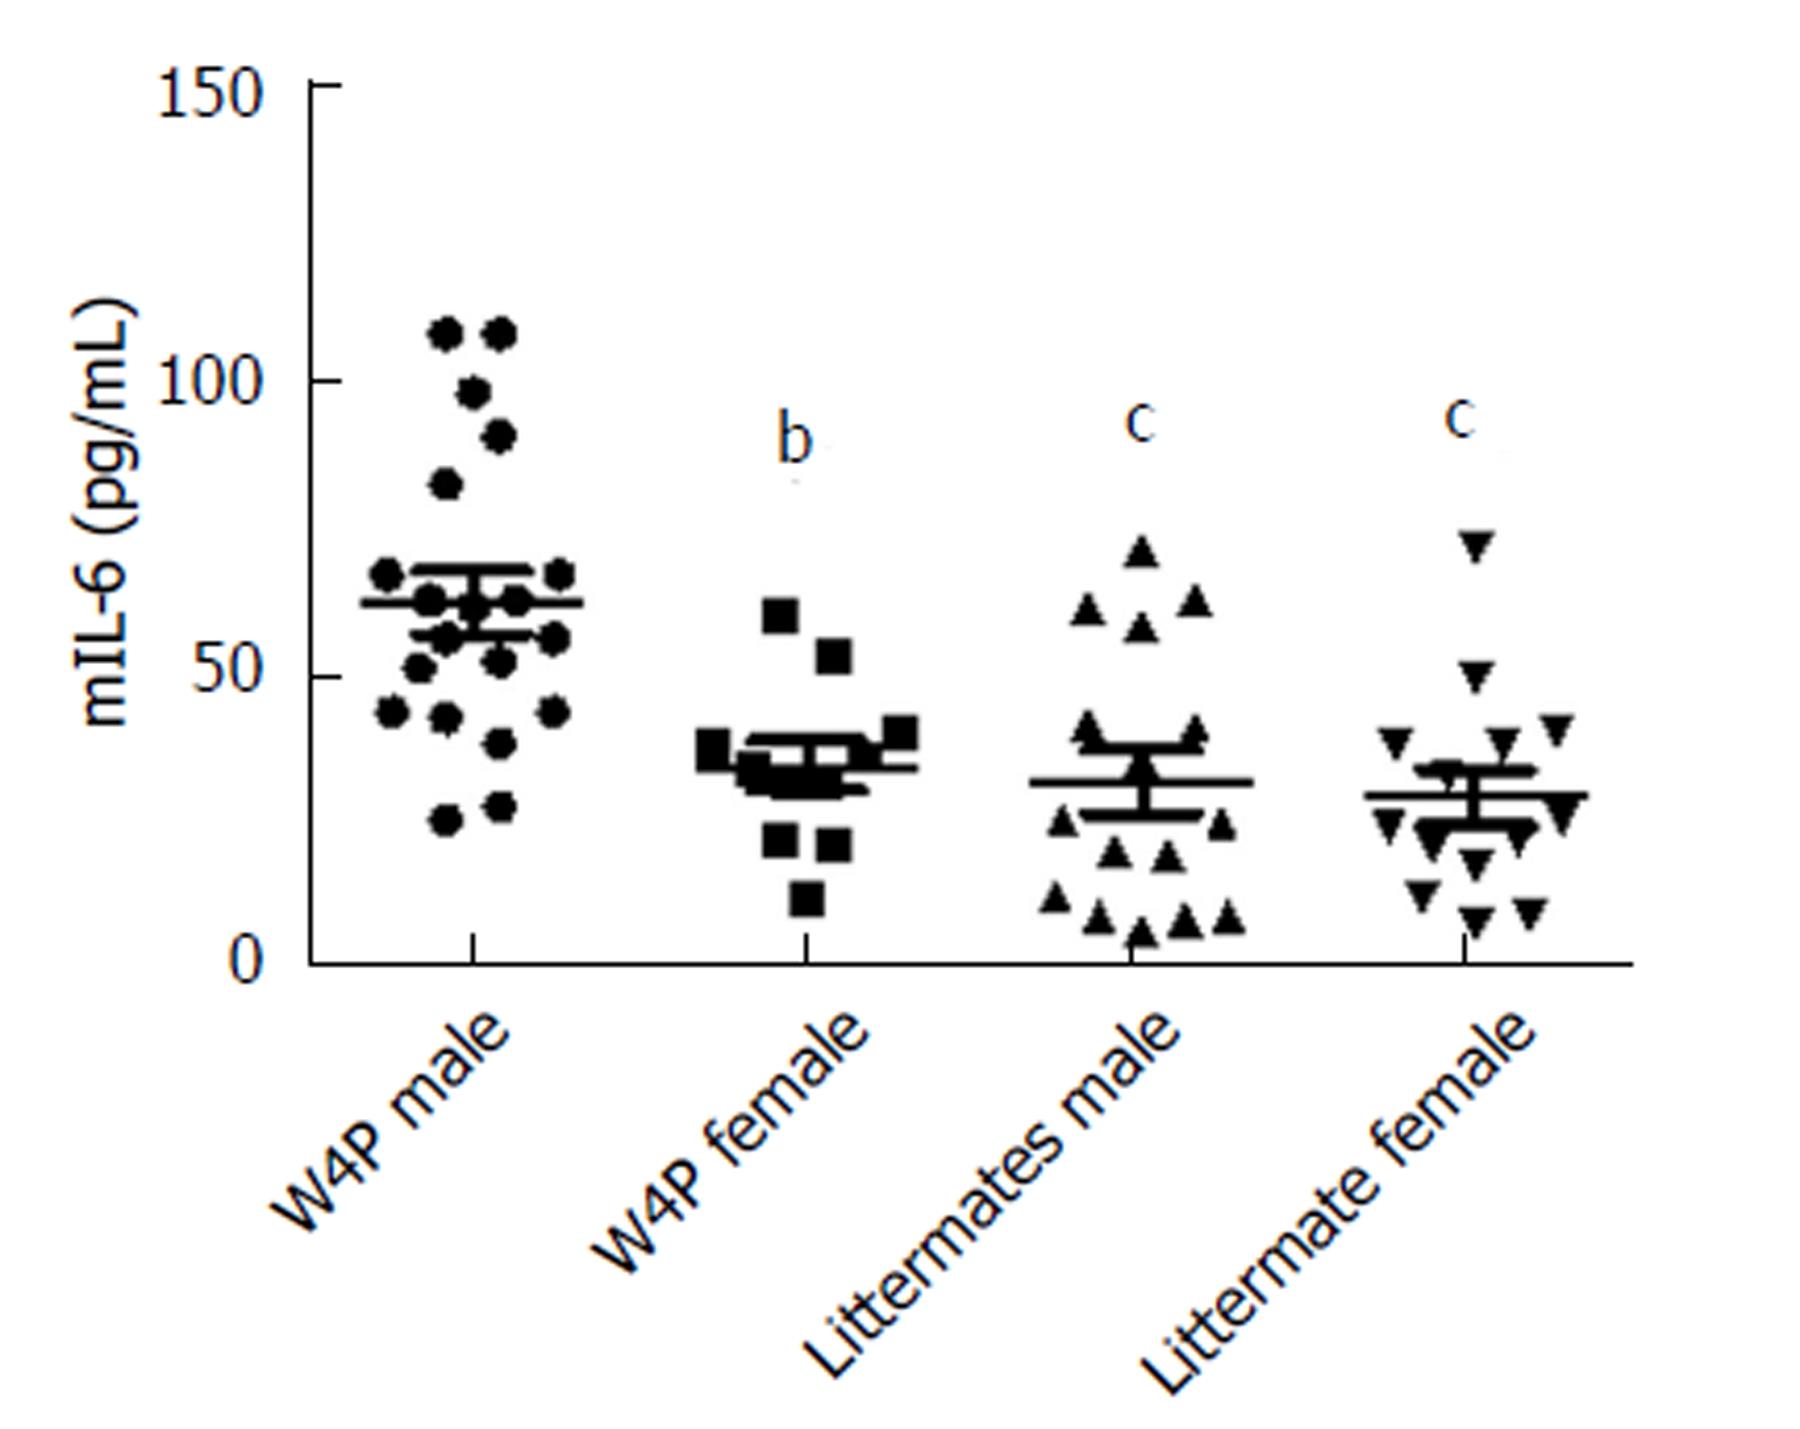
Figure 6 Secreted interleukin-6 levels in the W4P TG mice (males: 24 mice; females: 18 mice) and nonTG littermates (males: 17 mice; females: 15 mice) at 10 mo of age.
(aP < 0.05, bP < 0.01, and cP < 0.001 vs W4P_male, one-way ANOVA). ALT: Alanine aminotransferase; AST: Aspartate transaminase; IL: Interleukin.
- Citation: Lee SA, Lee SY, Choi YM, Kim H, Kim BJ. Sex disparity in viral load, inflammation and liver damage in transgenic mice carrying full hepatitis B virus genome with the W4P mutation in the preS1 region. World J Gastroenterol 2018; 24(10): 1084-1092
- URL: https://www.wjgnet.com/1007-9327/full/v24/i10/1084.htm
- DOI: https://dx.doi.org/10.3748/wjg.v24.i10.1084


