Copyright
©The Author(s) 2017.
World J Gastroenterol. Feb 28, 2017; 23(8): 1477-1488
Published online Feb 28, 2017. doi: 10.3748/wjg.v23.i8.1477
Published online Feb 28, 2017. doi: 10.3748/wjg.v23.i8.1477
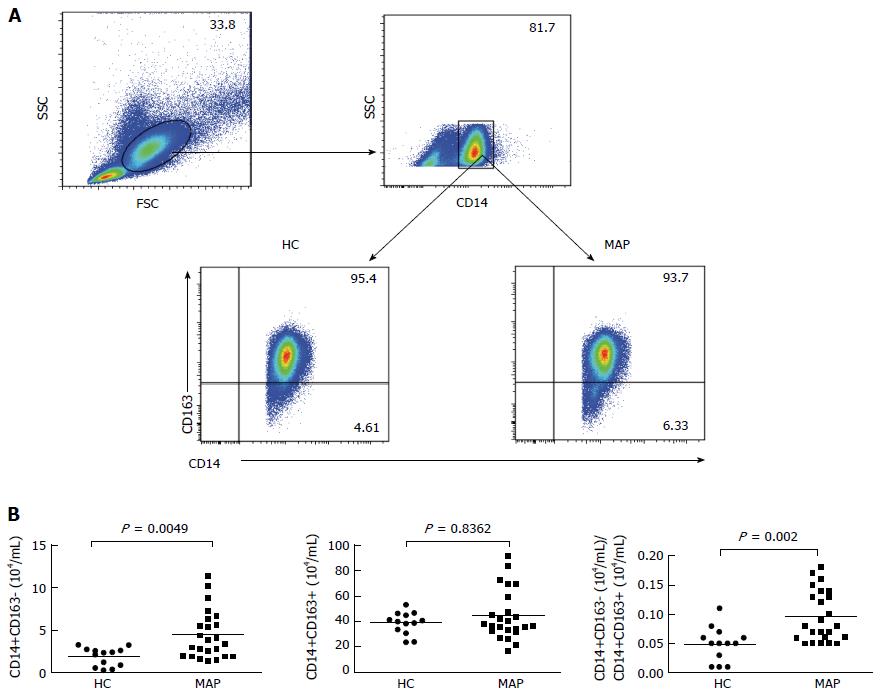
Figure 1 Flow cytometry analysis of peripheral blood monocytes.
Peripheral blood mononuclear cells (PBMCs) were obtained from individual subjects and stained in duplicate with BV510-anti-CD14 and PE/Cy7-anti-CD163 or isotype control antibodies. The cells were gated initially on living mononuclear cells and then on CD14+ monocytes. Subsequently, the frequency of CD14+CD163- M1 and CD14+CD163+ M2 monocytes were determined by flow cytometry and the numbers of each subset of monocytes were calculated, based on total numbers of monocytes. Data are representative charts of flow cytometry and expressed as the mean values of individual subjects (n = 13 for the healthy controls, n = 24 for the patients). A: Flow cytometry analysis; B: Quantitative analysis. The horizontal lines indicate the median values for individual groups. FSC: Forward scatter; SSC: Side scatter; HC: Healthy control; MAP: Mild acute pancreatitis.
Figure 2 Flow cytometry analysis of peripheral blood MAC387+ monocytes.
Peripheral blood mononuclear cells (PBMCs) were isolated from individual subjects and stained in duplicate with BV510-anti-CD14 and PE/Cy7-anti-CD163 or isotype controls. After being washed, the cells were fixed and permeabilized using a fixation/permeabilization kit, followed by intracellular staining with FITC-anti-MAC387. The numbers of peripheral blood CD14+CD163+MAC387+ and CD14+CD163-MAC387+ monocytes were analyzed by flow cytometry. Data are representative FACS charts and expressed as the mean numbers of each type of cells in individual subjects. The horizontal lines indicate the median values for each group. FSC: Forward scatter; SSC: Side scatter; HC: Healthy control; MAP: Mild acute pancreatitis.
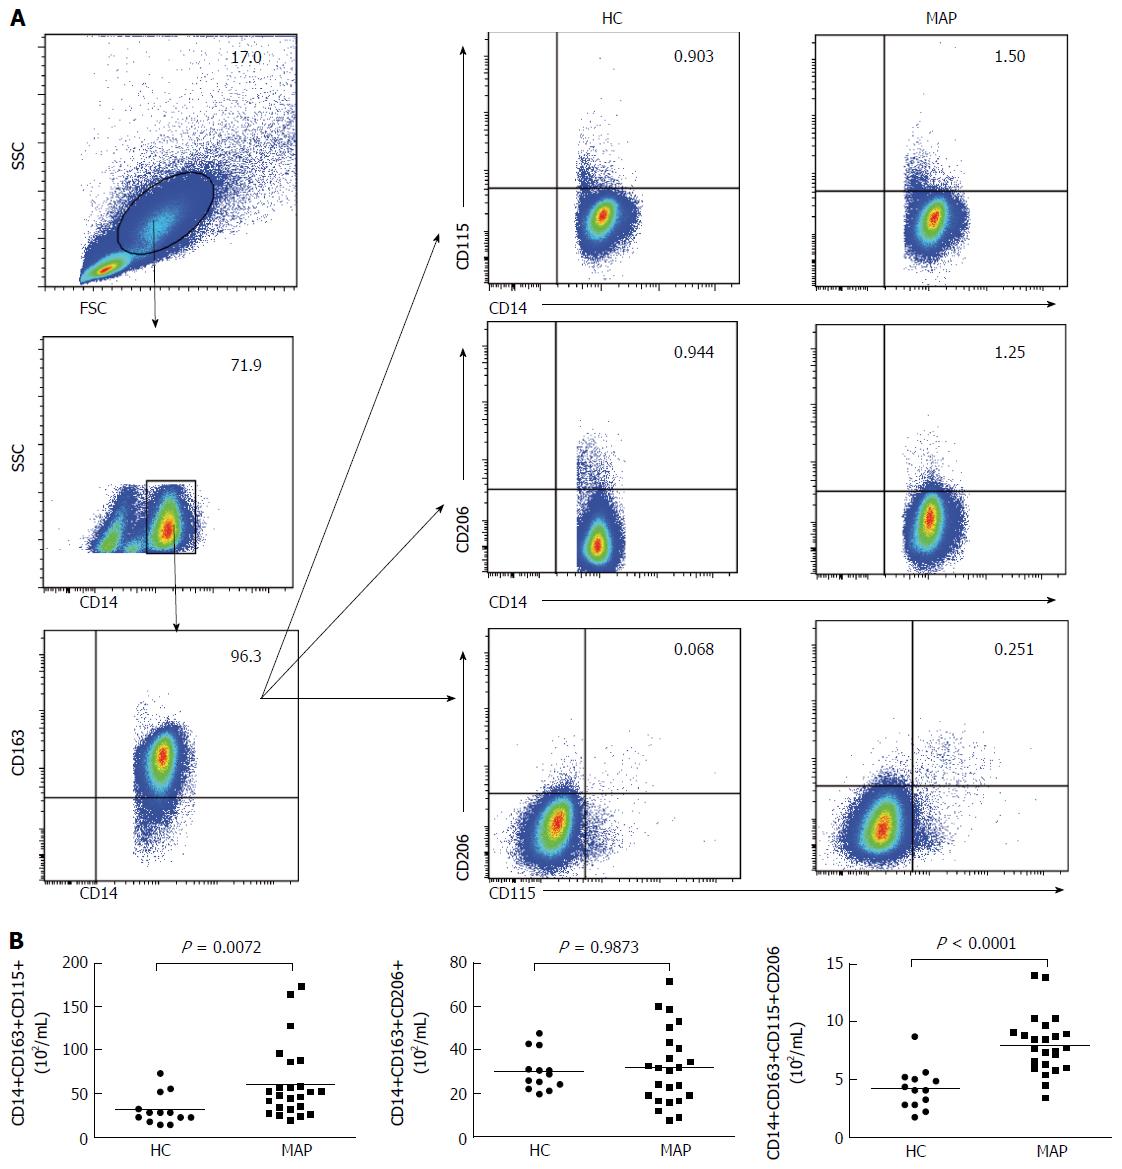
Figure 3 Flow cytometry analysis of peripheral blood CD206+ and CD115+ M2 monocytes.
Peripheral blood mononuclear cells (PBMCs) were isolated from individual subjects and stained in duplicate with BV510-anti-CD14, PE/Cy7-anti-CD163, PE-anti-CD115, and APC/Cy7-anti-206 or isotype controls. The numbers of peripheral blood CD14+CD163+CD206+, CD14+CD163+CD115+ and CD14+CD163+CD206+CD115+ M2 monocytes were analyzed by flow cytometry. Data shown are representative FACS charts and expressed as the mean numbers of each type of cells per mL of blood in individual subjects. The horizontal lines indicate the median values for each group. FSC: Forward scatter; SSC: Side scatter; HC: Healthy control; MAP: Mild acute pancreatitis.
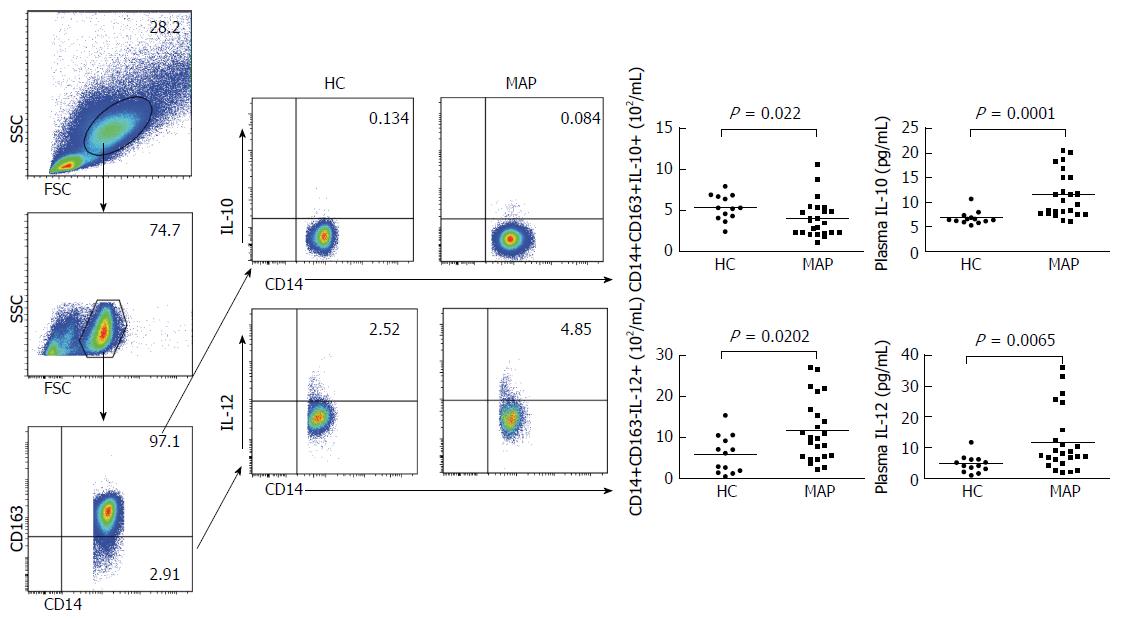
Figure 4 Analysis of peripheral blood IL-12+ M1 and IL-10+ M2 monocytes and the concentrations of plasma IL-10 and IL-12.
Peripheral blood mononuclear cells (PBMCs) were isolated from individual subjects and stimulated with lipopolysaccharide /phorbol myristate acetate/ionomycin in vitro. The cells were stained in duplicate with BV510-anti-CD14 and PE/Cy7-anti-CD163 or isotype controls. The cells were fixed, and permeabilized, followed by intracellular staining with BV421-anti-IL-12 and PE-CF594-anti-IL-10. The numbers of peripheral blood CD14+CD163-IL-12+ M1 and CD14+CD163+IL-10+ M2 monocytes in individual subjects were determined by flow cytometry. The concentrations of plasma IL-10 and IL-12 in individual subjects were determined by cytometric bead analysis. Data are representative FACS charts or the mean numbers of each type of cells and the mean values of each type of cytokine in individual subjects. The horizontal lines indicate the median values for each group. FSC: Forward scatter; SSC: Side scatter; HC: Healthy control; MAP: Mild acute pancreatitis.
Figure 5 Correlation analysis.
The potential correlations between the numbers of each subset of monocytes and APACHE II scores or CRP levels in those patients were analyzed by the Spearman rank correlation test. Data shown are the values of individual patients (n = 24). CRP: C-reactive protein; APACHE: Acute physiology and chronic health evaluation.
- Citation: Zhang ML, Jiang YF, Wang XR, Ding LL, Wang HJ, Meng QQ, Gao PJ. Different phenotypes of monocytes in patients with new-onset mild acute pancreatitis. World J Gastroenterol 2017; 23(8): 1477-1488
- URL: https://www.wjgnet.com/1007-9327/full/v23/i8/1477.htm
- DOI: https://dx.doi.org/10.3748/wjg.v23.i8.1477


