Copyright
©The Author(s) 2017.
World J Gastroenterol. Feb 21, 2017; 23(7): 1278-1288
Published online Feb 21, 2017. doi: 10.3748/wjg.v23.i7.1278
Published online Feb 21, 2017. doi: 10.3748/wjg.v23.i7.1278
Figure 1 Study selection.
PDT: Photodynamic therapy.
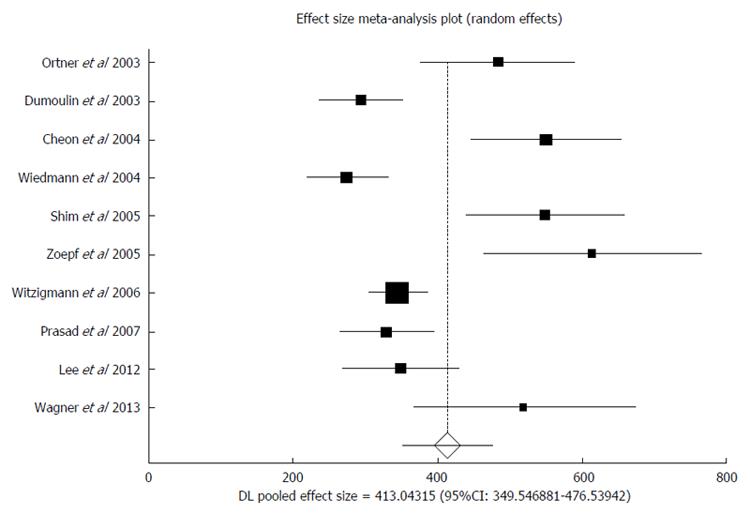
Figure 2 Forest plot - individual study proportions and the pooled estimate of survival period in photodynamic therapy group.
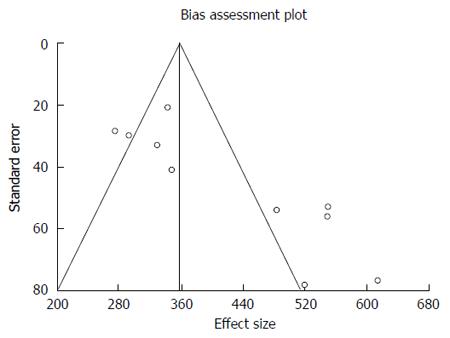
Figure 3 Funnel plot: Survival in photodynamic therapy group.
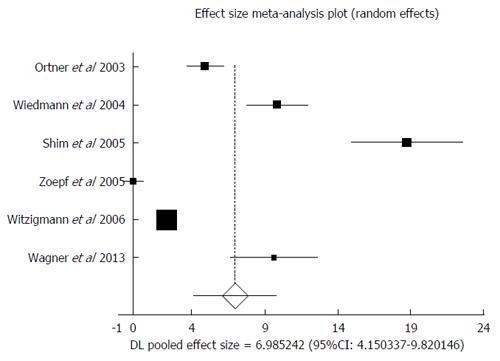
Figure 4 Forest plot - individual study proportions and the pooled estimate of change in Karnofsky performance scores in photodynamic therapy group.
Figure 5 Forest plot - individual study proportions and the pooled estimate of odds ratio - successful biliary drainage in photodynamic therapy group vs biliary stenting group.
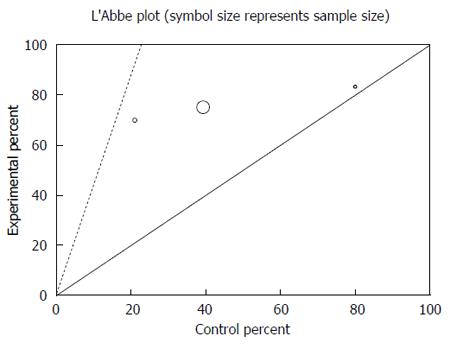
Figure 6 L’Abbe plot for odds ratio - successful biliary drainage in photodynamic therapy group vs biliary stenting group.
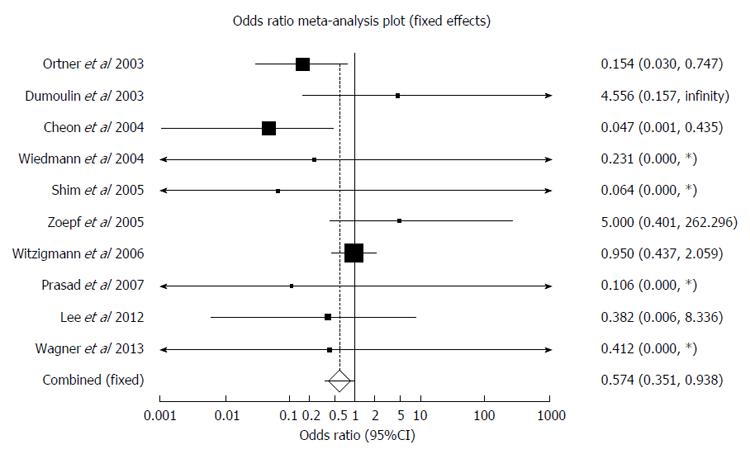
Figure 7 Forest plot - individual study proportions and the pooled estimate of odds ratio - cholangitis in photodynamic therapy group vs biliary stenting group.
Figure 8 Funnel plot - odds ratio for cholangitis in photodynamic therapy group vs biliary stenting group.
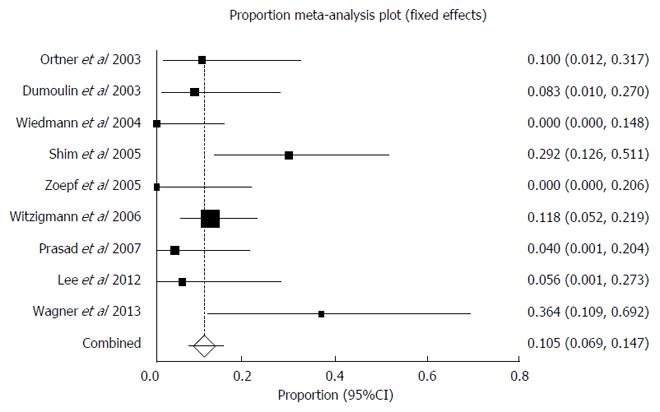
Figure 9 Forest plot - individual study proportions and the pooled estimate of photosensitivity reactions in photodynamic therapy group.
- Citation: Moole H, Tathireddy H, Dharmapuri S, Moole V, Boddireddy R, Yedama P, Dharmapuri S, Uppu A, Bondalapati N, Duvvuri A. Success of photodynamic therapy in palliating patients with nonresectable cholangiocarcinoma: A systematic review and meta-analysis. World J Gastroenterol 2017; 23(7): 1278-1288
- URL: https://www.wjgnet.com/1007-9327/full/v23/i7/1278.htm
- DOI: https://dx.doi.org/10.3748/wjg.v23.i7.1278


