Copyright
©The Author(s) 2017.
World J Gastroenterol. Feb 21, 2017; 23(7): 1268-1277
Published online Feb 21, 2017. doi: 10.3748/wjg.v23.i7.1268
Published online Feb 21, 2017. doi: 10.3748/wjg.v23.i7.1268
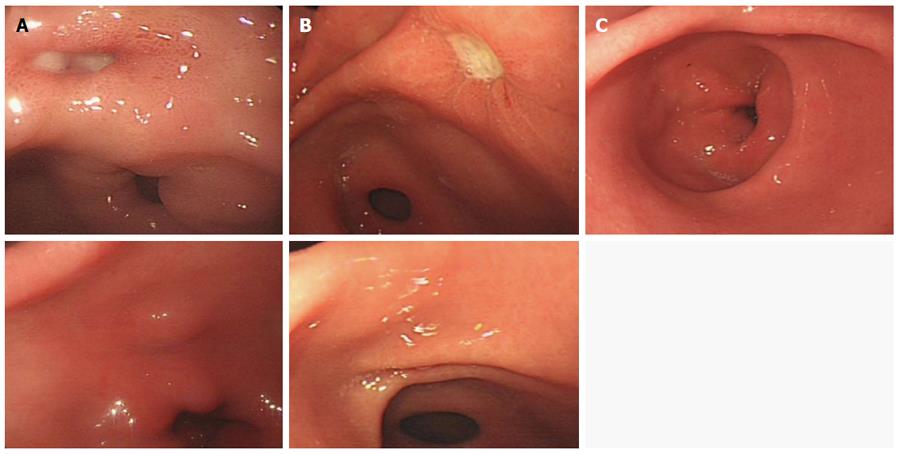
Figure 1 White light endoscopic assessment of ulcer healing quality.
A: Combination therapy before and after treatment; B: Monotherapy before and after treatment; C: Healthy control group. Both the combination therapy and monotherapy groups had high quality ulcer healing.
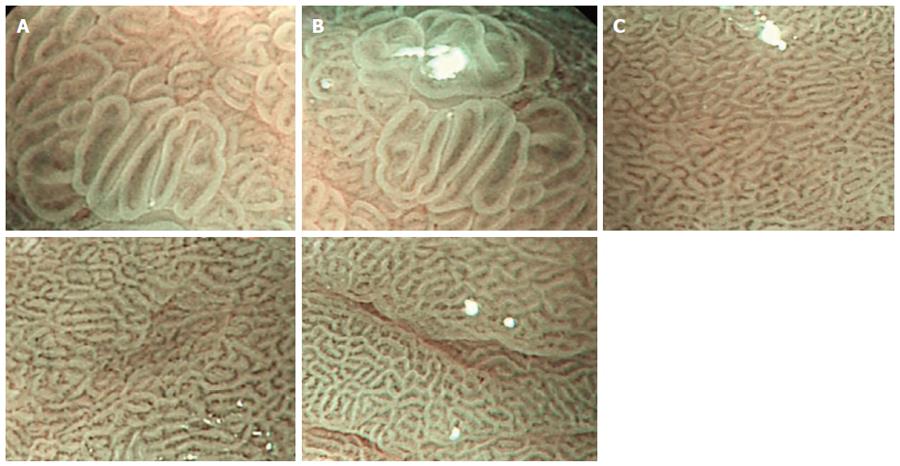
Figure 2 Gastric pits and microvascular morphology by narrow band imaging magnifying endoscopy.
A: Combination therapy before and after treatment; B: Monotherapy before and after treatment; C: Healthy control group. With regeneration of the gastric mucosal epithelium, the gastric pits and microvascular network were reconstructed. Both the combination therapy and monotherapy groups had improved gastric pit morphology after treatment, which was similar to normal mucosal tissue. However, the percentage of regular microvascular network was much higher.
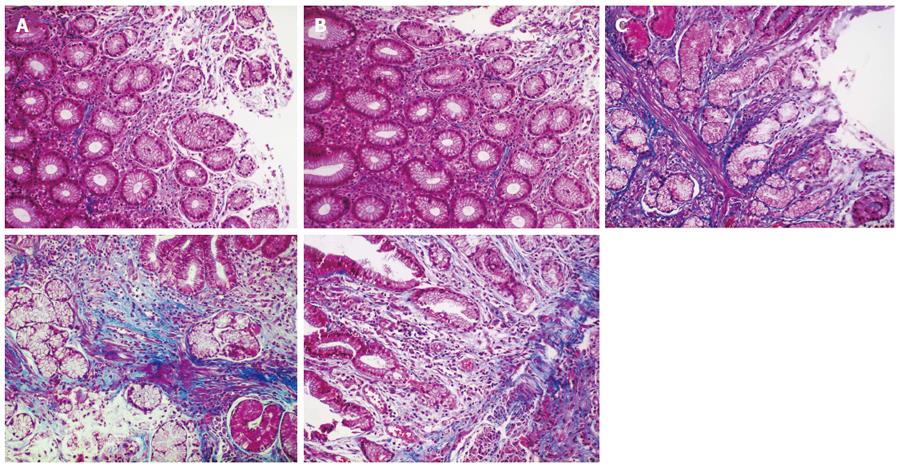
Figure 3 Gastric mucosal fibrosis was evaluated by Masson’s trichrome staining in a 200 × field.
Blue-stained signals represent fibrosis. A: Combination therapy before and after treatment; B: Monotherapy before and after treatment; C: Healthy control group. The area of collagen fiber deposition in the combination therapy group was significantly larger than that in the monotherapy group after treatment, and was similar to that in normal mucosal tissue.
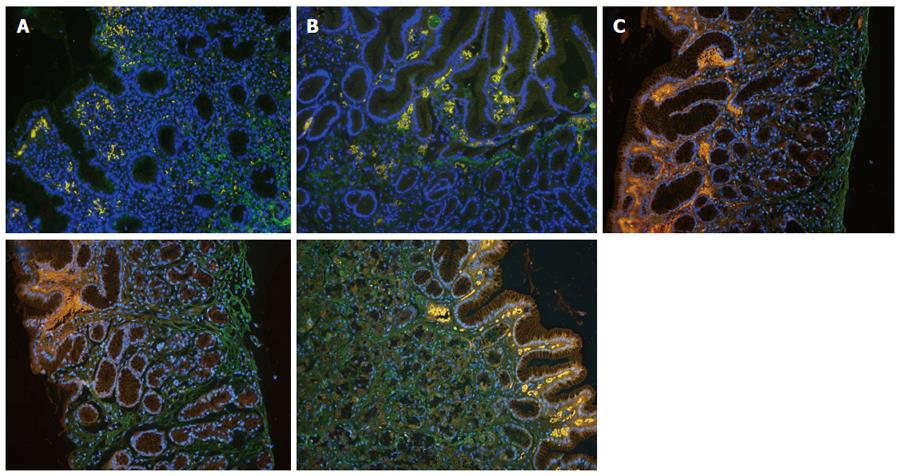
Figure 4 Expression of collagen I and III was analyzed using immunofluorescent staining in a 200 × field.
Nuclei were stained blue, collagen I stained red, collagen III stained green, and the overlap of collagen I and collagen III stained yellow. A: Results of combination therapy before and after treatment; B: Results of monotherapy before and after treatment; C: Results in the healthy control group. The deposition area of collagen I and III in the combination therapy group after treatment was similar to that in the normal control group.
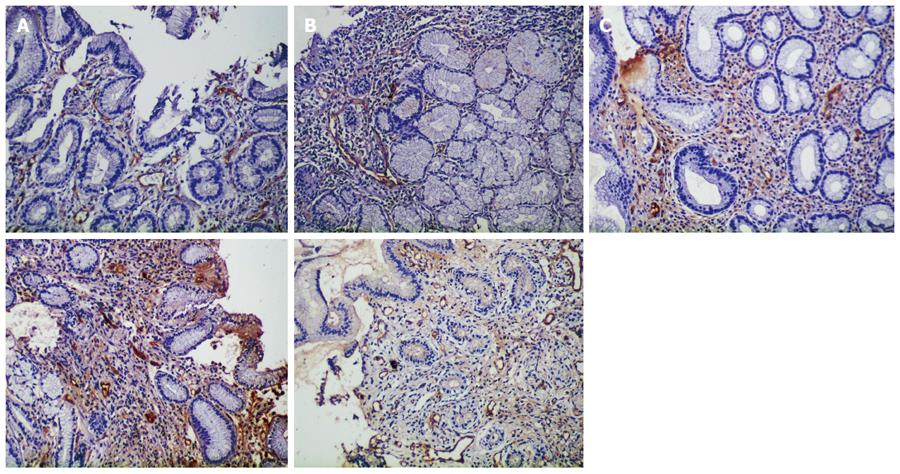
Figure 5 Expression of FactorVIII was analyzed using immunohistochemical staining in a 200 × field.
Yellow-stained signals in the cytoplasm and (or) cell membrane represent positive cells. A: Results of combination therapy before and after treatment; B: Results of monotherapy before and after treatment; C: Results in healthy control group. The expression of FactorVIII in the combination therapy group after treatment was significantly higher than that in the monotherapy and healthy control groups.
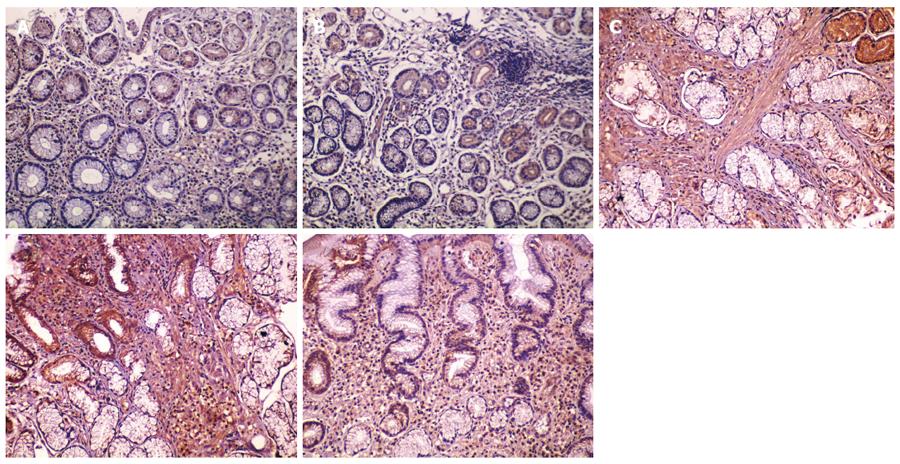
Figure 6 Expression of TGF-β1 was analyzed using immunohistochemical staining in a 200 × field.
Yellow-stained signals in the cytoplasm and (or) cell membrane represent positive cells. A: Results of combination therapy before and after treatment; B: Results of monotherapy before and after treatment; C: Results in the healthy control group. The expression of TGF-β1 in the combination therapy group was significantly higher than that in the monotherapy group, and similar to that in the healthy control group.
- Citation: Yang RQ, Mao H, Huang LY, Su PZ, Lu M. Effects of hydrotalcite combined with esomeprazole on gastric ulcer healing quality: A clinical observation study. World J Gastroenterol 2017; 23(7): 1268-1277
- URL: https://www.wjgnet.com/1007-9327/full/v23/i7/1268.htm
- DOI: https://dx.doi.org/10.3748/wjg.v23.i7.1268


