Copyright
©The Author(s) 2017.
World J Gastroenterol. Feb 14, 2017; 23(6): 1018-1029
Published online Feb 14, 2017. doi: 10.3748/wjg.v23.i6.1018
Published online Feb 14, 2017. doi: 10.3748/wjg.v23.i6.1018
Figure 1 Flowchart of included participants in the magnetic resonance imaging analyses.
CD: Crohn’s disease; VBM: Voxel based morphometry; MTI: Magnetization transfer images; MRS: Magnetic resonance spectroscopy; ASL: Arterial spin labelling; DTI: Diffusion tensor imaging.
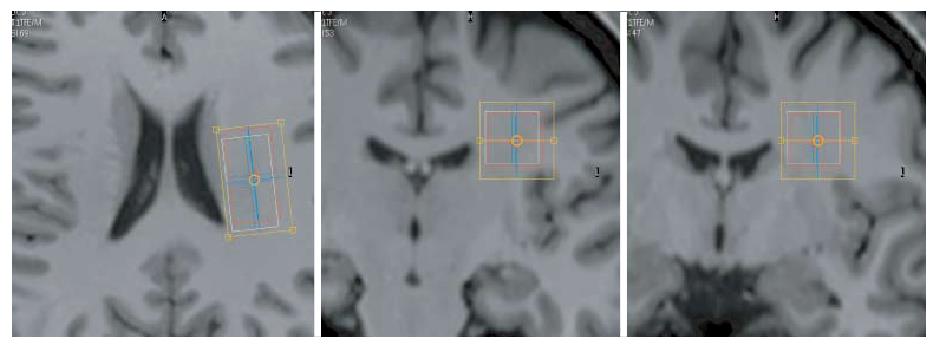
Figure 2 Planning of the 1H-magnetic resonance spectroscopy volume of interest in the left centrum semi-ovale.
Seen on axial (left) and on the coronal (right) T1-weighted image slices. The effective volume of interest set at the tNAA frequency is shown (red rectangle) together with the shimming volume (yellow rectangle).
Math 1 Math(A1).
Figure 3 FMRIB Software Library voxel based morphometry analysis.
Voxel based morphometry results shown on MNI152 standard space. The red colour indicates the voxels with significantly reduced grey matter volume in CD patients compared with healthy controls (with a P-value < 0.05, corrected for multiple comparison). The red voxels correspond to the left superior frontal gyrus.
- Citation: van Erp S, Ercan E, Breedveld P, Brakenhoff L, Ghariq E, Schmid S, Osch MV, van Buchem M, Emmer B, van der Grond J, Wolterbeek R, Hommes D, Fidder H, van der Wee N, Huizinga T, van der Heijde D, Middelkoop H, Ronen I, van der Meulen-de Jong A. Cerebral magnetic resonance imaging in quiescent Crohn’s disease patients with fatigue. World J Gastroenterol 2017; 23(6): 1018-1029
- URL: https://www.wjgnet.com/1007-9327/full/v23/i6/1018.htm
- DOI: https://dx.doi.org/10.3748/wjg.v23.i6.1018


