Copyright
©The Author(s) 2017.
World J Gastroenterol. Dec 28, 2017; 23(48): 8570-8581
Published online Dec 28, 2017. doi: 10.3748/wjg.v23.i48.8570
Published online Dec 28, 2017. doi: 10.3748/wjg.v23.i48.8570
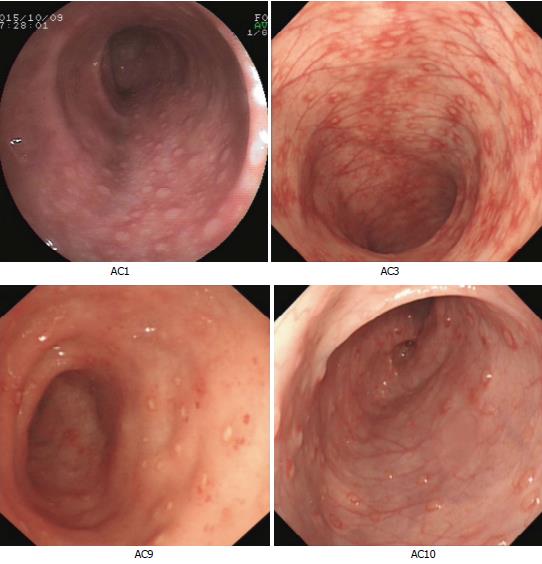
Figure 1 Colonoscopic inspection of four allergic colitis patients prior to fecal microbiota transplantation.
Colonoscopic images of patients (AC1, AC3, AC9, and AC10) were obtained prior to FMT. AC: Allergic colitis; FMT: Fecal microbiota transplantation.
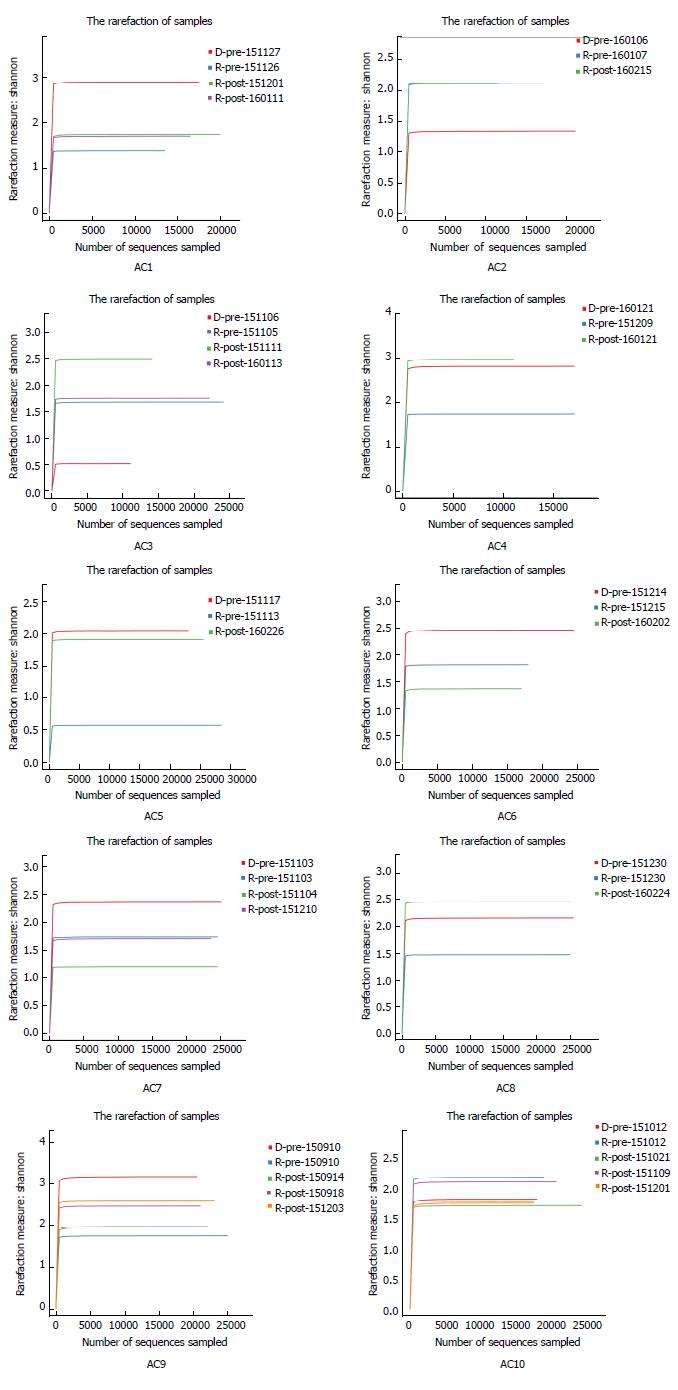
Figure 2 Shannon rarefaction curves of gut microbiota from ten allergic colitis infants and their donors.
Each image represents one AC infant, and each curve represents one fecal sample from a patient or the corresponding donor. Sample ID has three parts: ‘R’ or ‘D’ indicates AC infants or donors, ’pre’ or ‘post’ represents the stools collected before or after FMT, and fecal collection date. Microbiota diversity in six patients (AC1, AC4, AC5, AC7, AC8, and AC9) increased after FMT treatment. AC: Allergic colitis; FMT: Fecal microbiota transplantation.
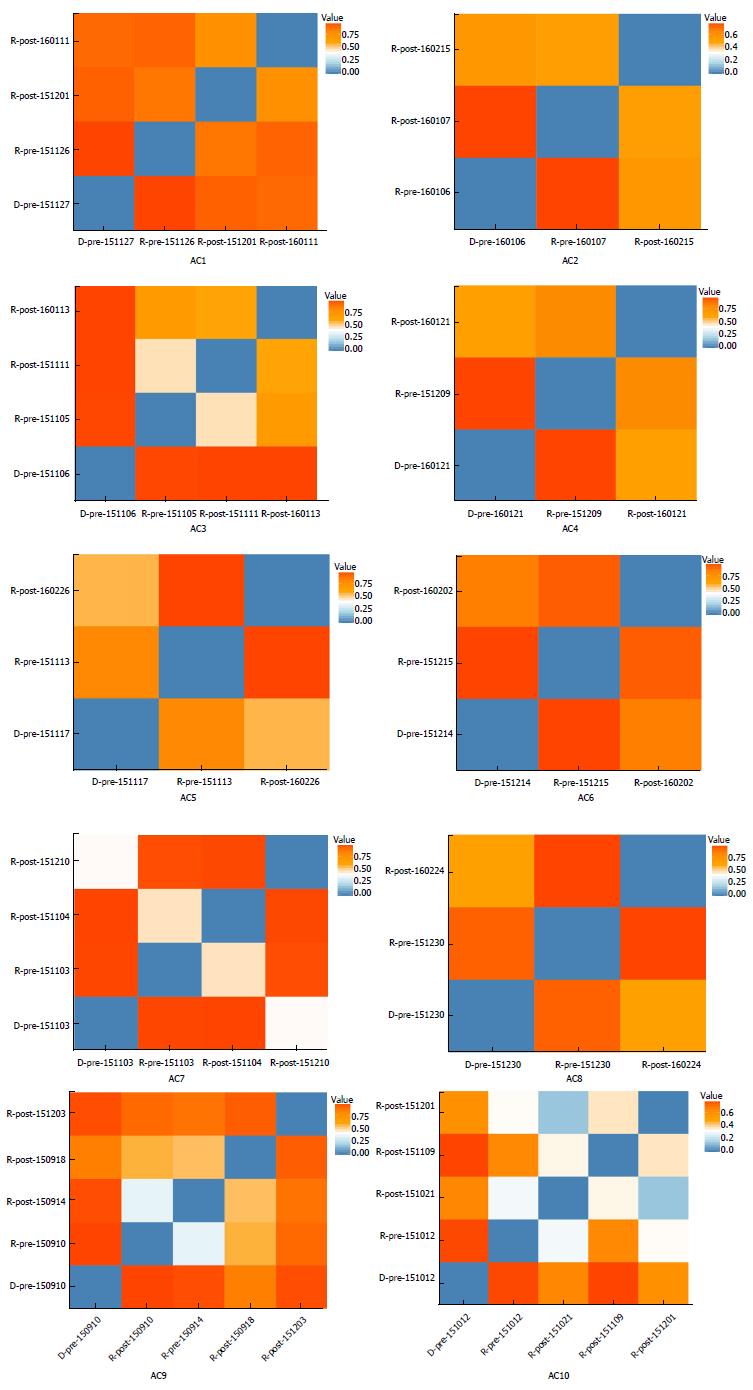
Figure 3 Microbiota similarity between allergic colitis infants and their donors.
Values in red indicate low microbiota similarity between two samples. Blue represents high microbiota similarity. The microbiota compositions of patients (AC1, AC2, AC4, AC5, AC6, AC7, AC8, and AC10) were more similar to their donors’ composition after FMT treatment. One patient (AC9) had more and then less microbiota similarity and AC3 did not change in this regard. AC: Allergic colitis.
- Citation: Liu SX, Li YH, Dai WK, Li XS, Qiu CZ, Ruan ML, Zou B, Dong C, Liu YH, He JY, Huang ZH, Shu SN. Fecal microbiota transplantation induces remission of infantile allergic colitis through gut microbiota re-establishment. World J Gastroenterol 2017; 23(48): 8570-8581
- URL: https://www.wjgnet.com/1007-9327/full/v23/i48/8570.htm
- DOI: https://dx.doi.org/10.3748/wjg.v23.i48.8570


