Copyright
©The Author(s) 2017.
World J Gastroenterol. Dec 28, 2017; 23(48): 8500-8511
Published online Dec 28, 2017. doi: 10.3748/wjg.v23.i48.8500
Published online Dec 28, 2017. doi: 10.3748/wjg.v23.i48.8500
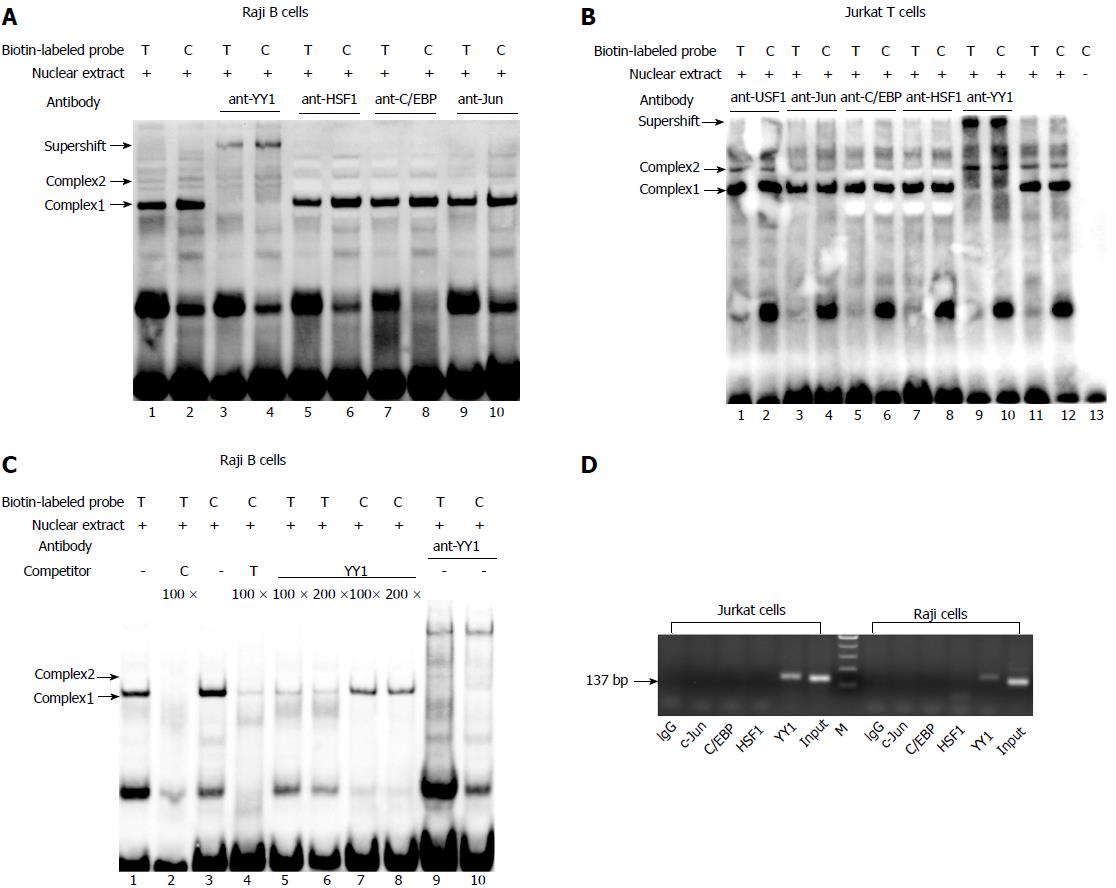
Figure 1 Identification of transcription factor binding to the T-1993C SNP site of TBX21 promoter in vitro and in vivo.
A, B: EMSA analysis with biotin-labeled probes carrying the -1993T and -1993C allele and with nuclear extract from Jurkat cells and Raji cells was performed in the presence of anti-YY1 antibody; C: EMSA with biotin-labeled probes and with nuclear extract from Raji cells was performed in the presence of 100-200-fold excess of unlabeled self-oligonucleotide or YY1 probe; D: In vivo binding of YY1 to the T-1993C SNP site of the TBX21 promoter. ChIP assays with an anti-YY1, anti-C/EBPβ, ant-C-Jun, or control antibody (rabbit IgG) were performed on Jurkat cells or Raji cells. Input DNA or Immunoprecipitated DNA was used as template for PCR amplification of a 137-bp amplicon encompassing TBX21-1993. EMSA: Electrophoretic mobility shift assay; ChIP: Chromatin immunoprecipitation.
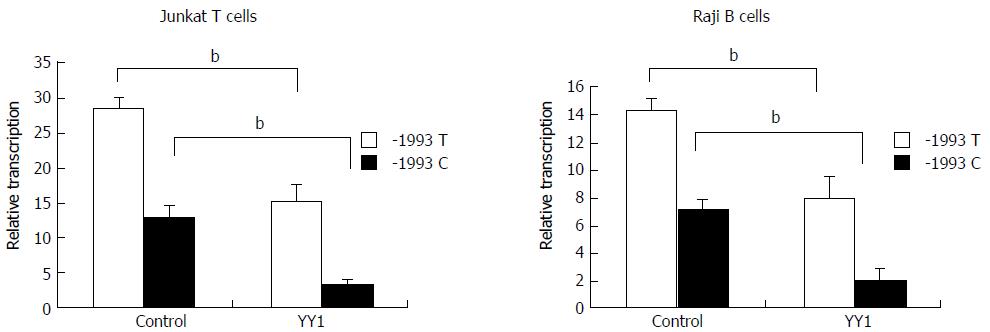
Figure 2 Effect of YY1 transcription factor on transcriptional activity of TBX21-1993T and -1993C promoter constructs.
Luciferase reporter assay showing relative luciferase activity of the -1993T and -1993C promoter constructs following co-transfection of Raji cells or of Jurkat cells with pCMV-YY1 or pCMV6-XL5 (control). The results are expressed as mean ± SD for three independent experiments; bP < 0.01.
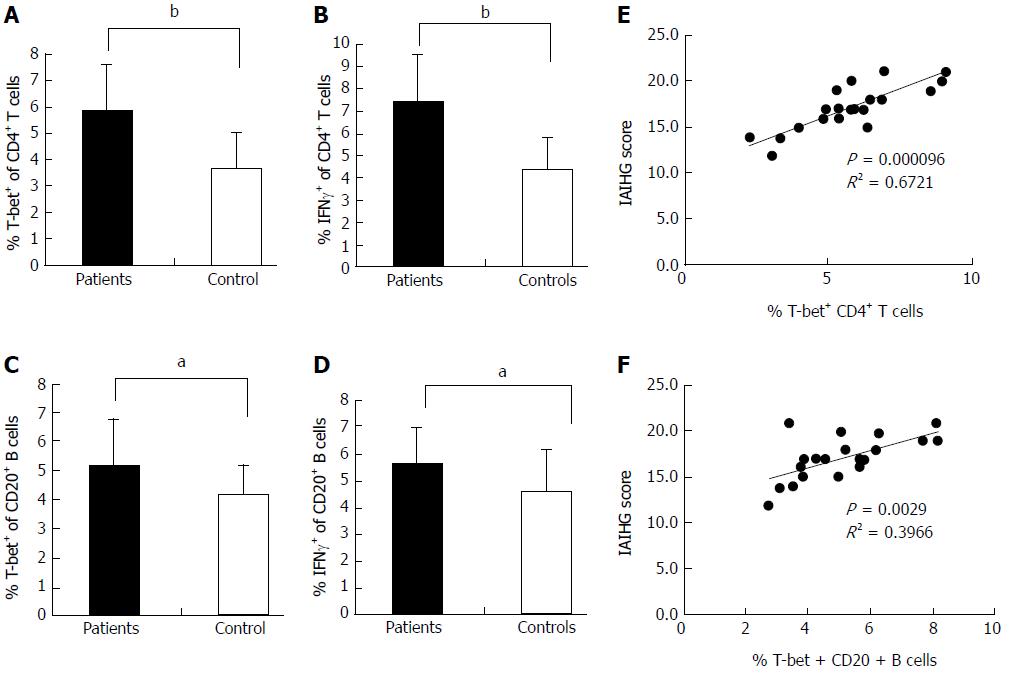
Figure 3 Expression of T-bet and IFN-γ in the peripheral blood of AIH-1 patients.
A-D: Flow cytometry showing the percentage of cells positive for T-bet and IFN-γ expression among the stimulated CD4+ T cells and CD20+ B cells from the peripheral bloods of 20 active AIH-1 patients and 35 healthy subjects; E-F: The correlation between the percentage of T-bet-expressing B cells or T cells and the IAIHG score in active AIH-1 patients. IAIHG, the International Autoimmune Hepatitis Group. aP < 0.05, bP < 0.01 vs controls.
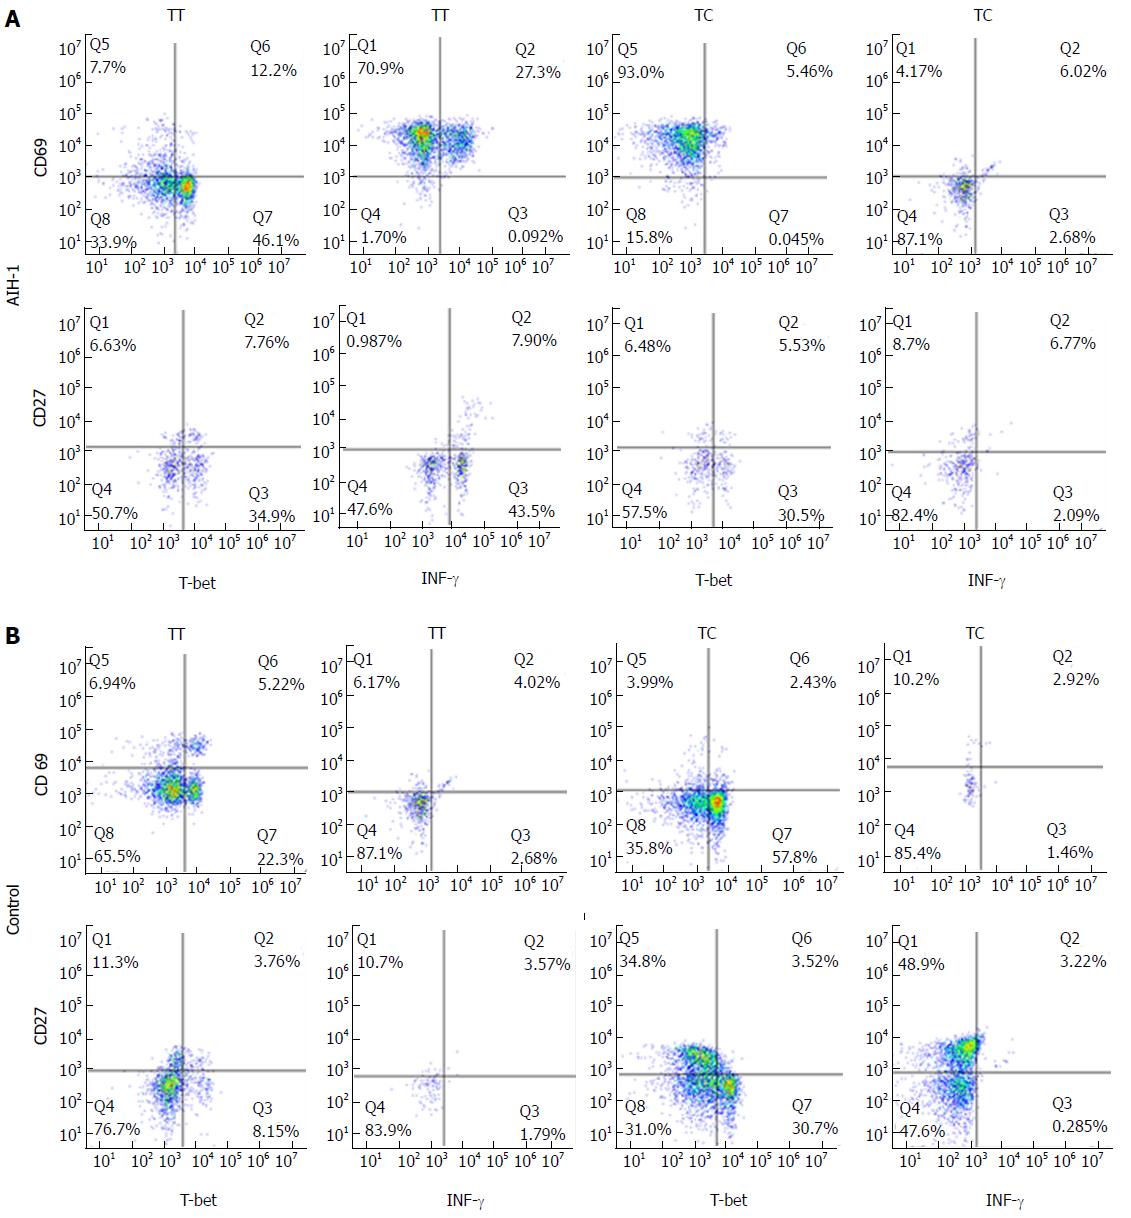
Figure 4 Representative two-parameter dot plots showing only the cells gated for CD4+ T and CD20+ B cells from the peripheral bloods of individuals carrying the TBX21-1993TC and -1993TT genotypes.
The y-axis of each histogram represents the specific fluorescence of extracellular CD69-phycoerythrin (PE) (T lymphocytes) and CD27-PE (B lymphocytes). The x-axis represents the specific fluorescence of Alexa-Flour 647-T-bet, FITC-IFNγ, or Cy5.5-IFN-γ on four-decade logarithmic scales. The quadrants were assigned using appropriate isotype controls for each intra- and extracellular antibody. A: AIH-1 patients; B: Healthy controls.
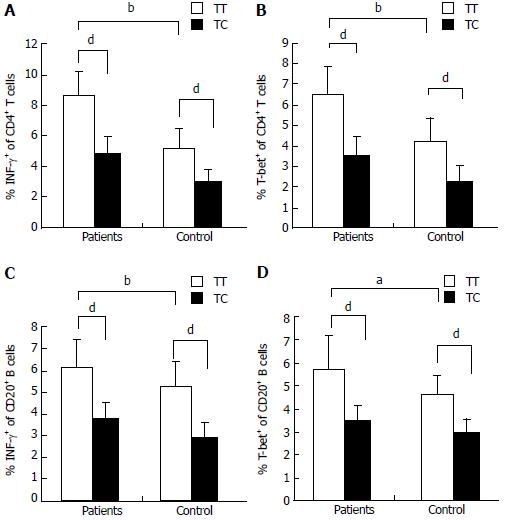
Figure 5 Expression of T-bet and IFN-γ in the peripheral blood of AIH-1 patients carrying -1993TC and -1993TT genotypes.
A-D: Flow cytometry showing the percentage of cells positive for T-bet and IFN-γ expression among the stimulated CD4+ T cells and CD20+ B cells from the peripheral bloods of active AIH-1 patients including 5-1993TC and 15-1993TT genotype carriers, and healthy subjects including 10-1993TC and 25-1993TT genotype carriers. aP < 0.05, bP < 0.01, vs controls; dP < 0.01, TT vs TC.
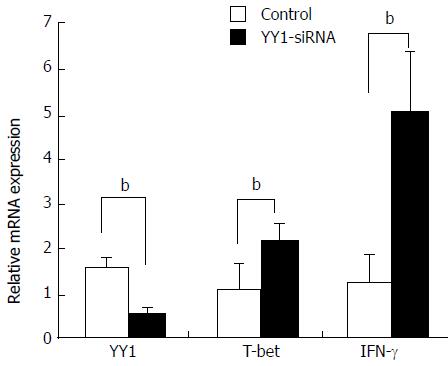
Figure 6 Effects of YY1 knockdown on T-bet and interferon-γ expression in peripheral blood mononuclear cells from autoimmune hepatitis type patients.
PBMCs were isolated from 20 AIH-1 patients. PBMCs were transfected with YY1-siRNA or control-siRNA. Forty-eight hours after transfection, the mRNA expression levels of YY1, T-bet and IFN-γ were measured by real-time PCR. bP < 0.01 vs control. PBMCs: Peripheral blood mononuclear cell.
- Citation: Sun W, Wu HY, Chen S. Influence of TBX21 T-1993C variant on autoimmune hepatitis development by Yin-Yang 1 binding. World J Gastroenterol 2017; 23(48): 8500-8511
- URL: https://www.wjgnet.com/1007-9327/full/v23/i48/8500.htm
- DOI: https://dx.doi.org/10.3748/wjg.v23.i48.8500


