Copyright
©The Author(s) 2017.
World J Gastroenterol. Dec 28, 2017; 23(48): 8452-8464
Published online Dec 28, 2017. doi: 10.3748/wjg.v23.i48.8452
Published online Dec 28, 2017. doi: 10.3748/wjg.v23.i48.8452
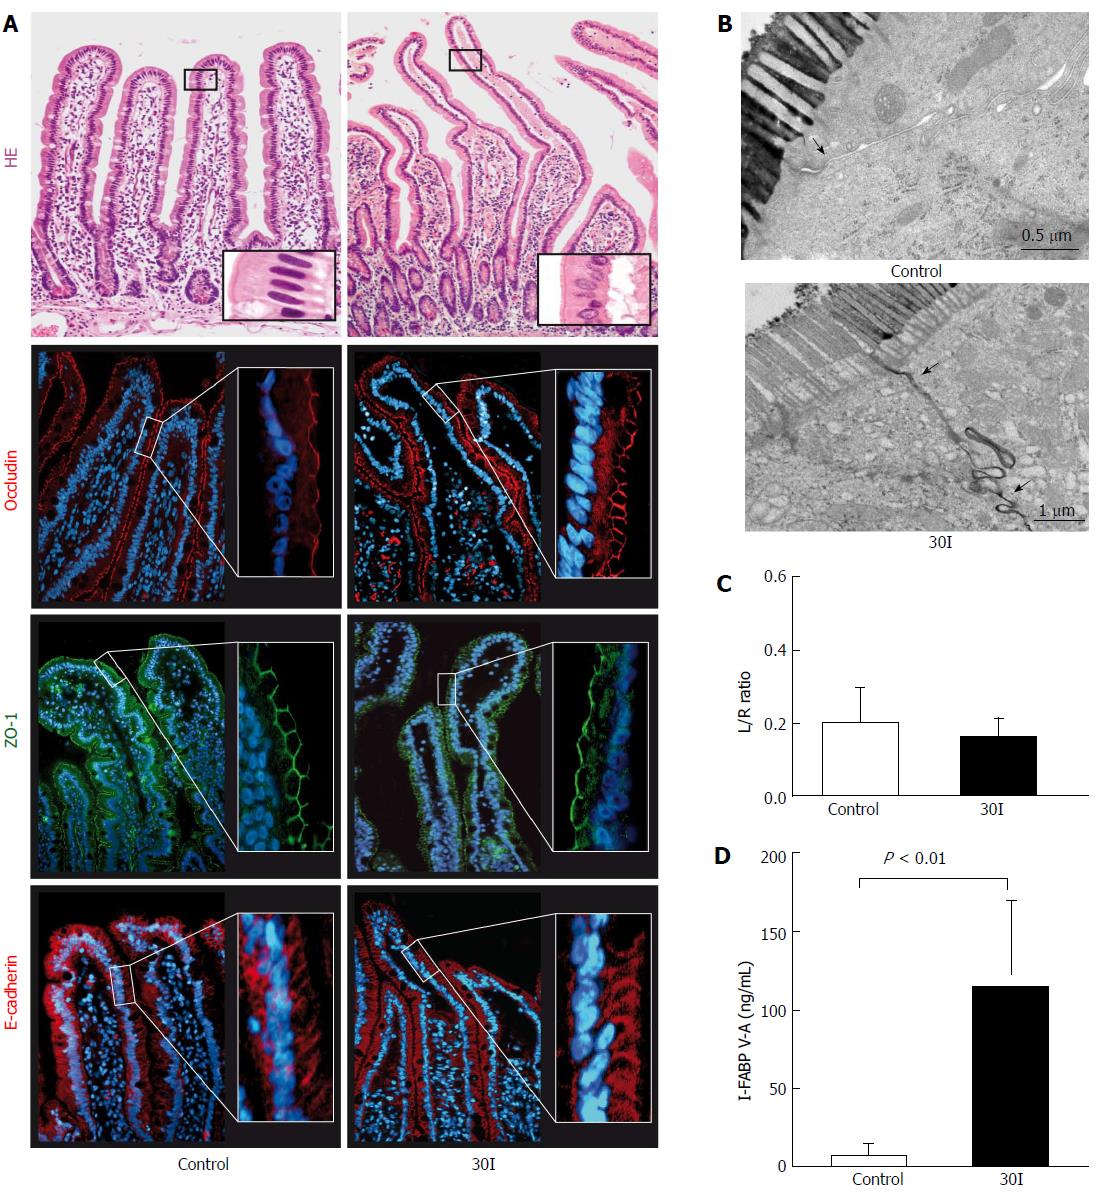
Figure 1 Changes in intestinal barrier function after 30 min of ischemia.
A: HE staining showed an intact epithelial lining in control tissue. After 30 min of ischemia (30I) subepithelial spaces were visualized at the tips of the villi. Strong and evenly distributed immunofluorescent stainings for ZO-1, occludin and E-Cadherin were observed, over the tips of the villi, in both control tissue and jejunum subjected to 30I; B: Electron microscopic images of two enterocytes with interconnecting tight junctions demonstrate in control tissue that tight junctions are intact (arrow) and the contrast dye lanthanum remains intraluminally. On the contrary, after 30I, lanthanum is able to penetrate the paracellular space, indicating tight junction integrity loss (arrow); C: Plasma L/R ratio’s however, remained unchanged after ischemia when compared with control; D: Mean plasma I-FABP V-A concentration differences show a significant release after ischemia when compared with control (126.6 ng/mL ± 65.53 ng/mL vs 1.75 ng/mL ± 0.78 ng/mL, P < 0.01), reflecting enterocyte damage. Electron microscopy scale bars = 0.5 μm and 1 μm respectively.
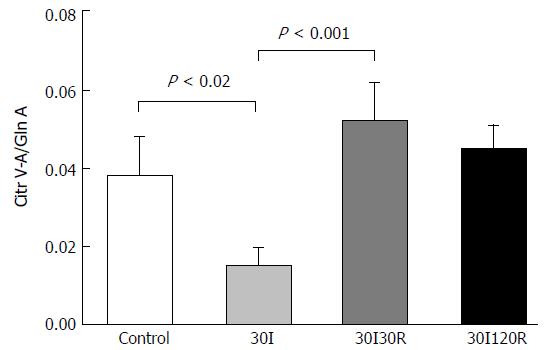
Figure 2 Mean Cit V-A/Gln A ratios in patients submitted to 30 min of ischemia followed by 30 and 120 min of reperfusion.
Ratios were significantly decreased after 30I compared to control. During reperfusion ratio’s return back to baseline values, which were no longer different compared to control. Results are presented as mean ± SE. A P-value of < 0.05 was considered significant.
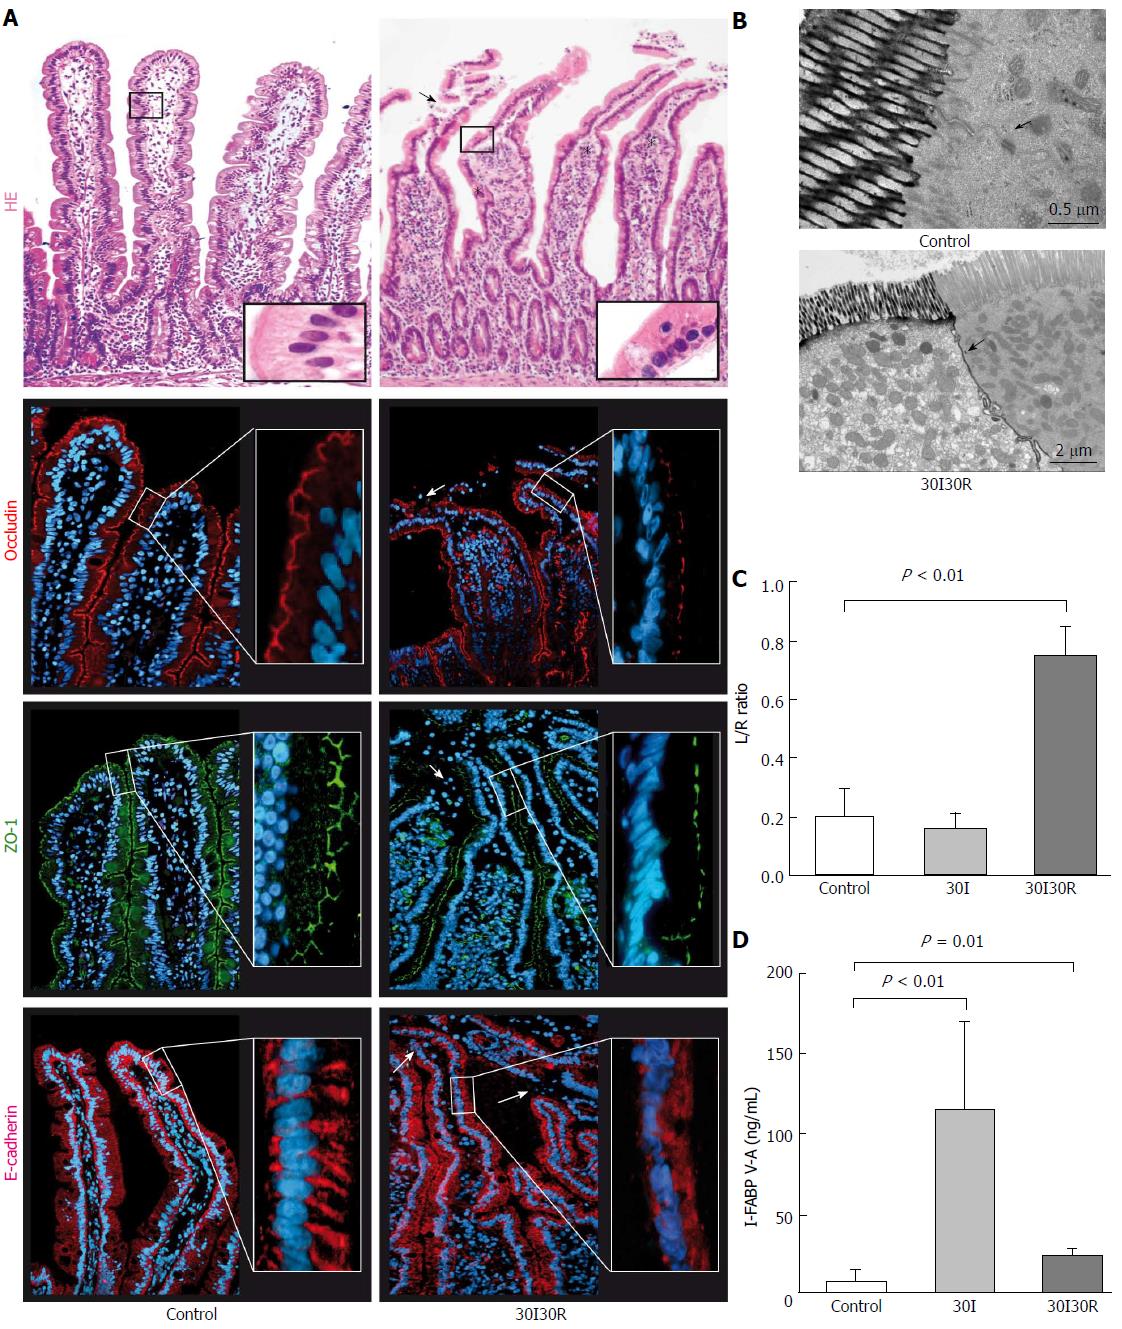
Figure 3 Thirty min of reperfusion results in tight junction damage and functional intestinal barrier loss.
A: After 30 min of reperfusion (30I30R) damaged epithelial cells were pinched off and shed into the lumen (arrow). Immunofluorescence for ZO-1 and occludin revealed irregular distribution patterns (arrowheads) and loss of expression in the epithelial sheets at the tips of the villi, together with the disruption of E-Cadherin showing only diffuse staining in the cell cytoplasm; B: Lanthanum was still able to penetrate between two adjacent enterocytes (arrowhead) demonstrating disruption of TJs and AJs at 30I30R; C: Plasma L/R ratio was significantly elevated at 30I30R compared to control (0.75 ± 0.10 vs 0.20 ± 0.09, P < 0.01), indicating increased intestinal permeability after short reperfusion; D: Plasma I-FABP gradually reduce following 30I30R but was still significantly elevated compared to control (27.06 ± 2.73 ng/mL vs 1.75 ± 0.78 ng/mL, P = 0.01), indicating entrocyte membrane integrity loss. Electron microscopy scale bars = 0.5 μm and 2 μm respectively.
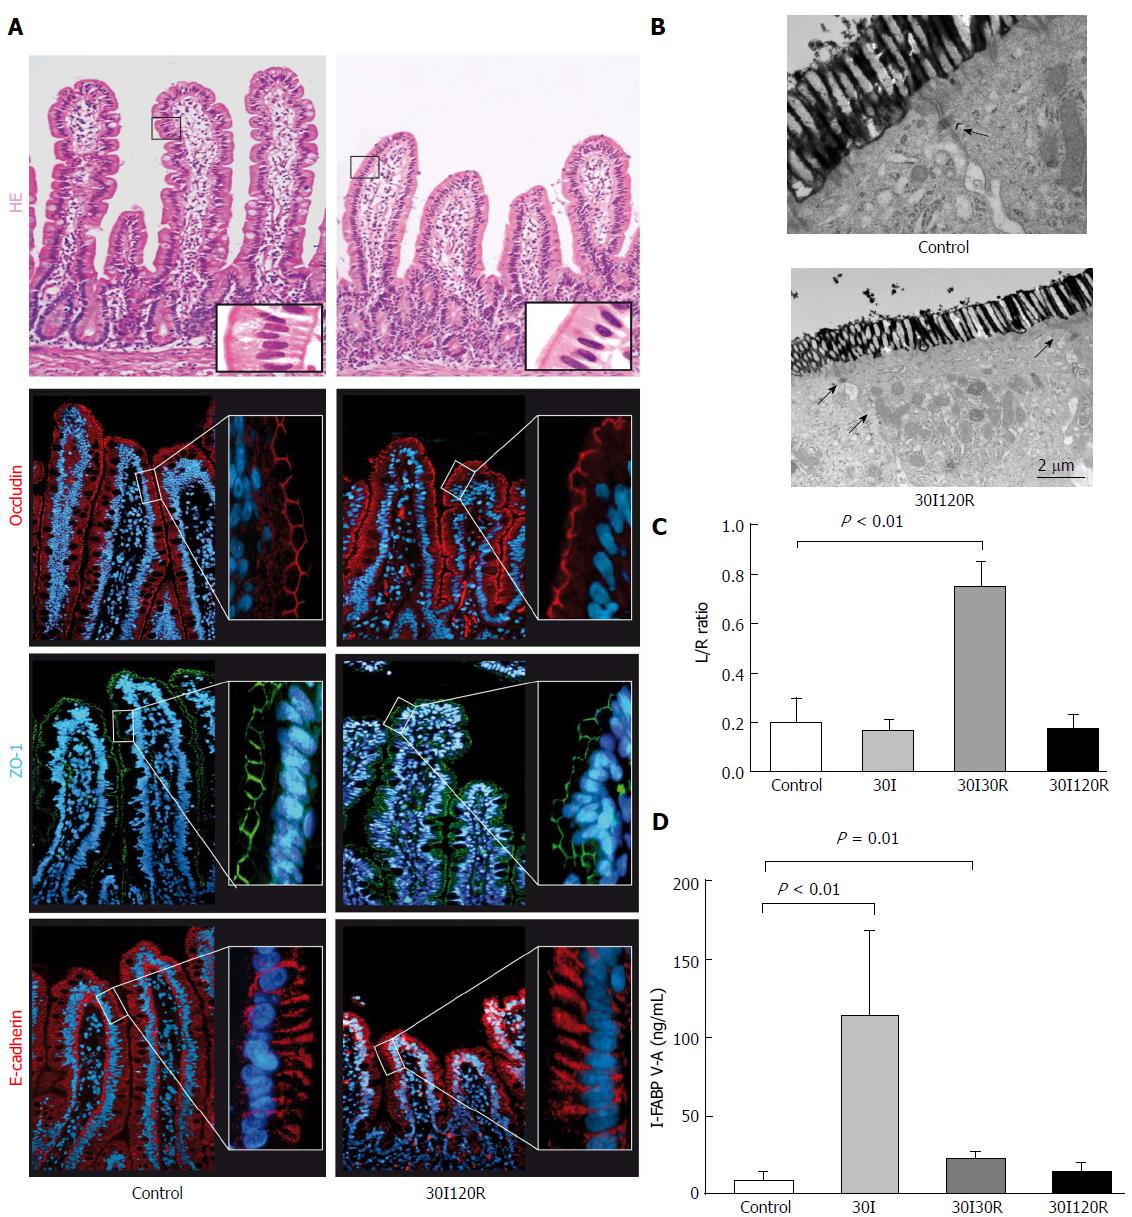
Figure 4 The intestinal barrier is restored after 30 min of ischema followed by 120 min of reperfusion.
A: At 120 min of reperfusion (30I120R) the epithelial lining appeared histologically intact compared to control tissue with ZO-1, occludin and E-Cadherin normally distributed across the villi.); B: In addition, electron microscopy revealed that lanthanum was no longer present in the paracellular spaces, indicating restored tight junction integrity; C: Moreover, the observed restoration of the intestinal barrier seems to correlate with permeability with the plasma L/R ratio normalized to 0.17 ± 0.06 which was no longer significantly different from control; D: Plasma I-FABP levels, reflecting intestinal epithelial damage, also returned to 14.77 ng/mL ± 5.46 ng/mL and were no longer significantly elevated compared to control. Electron microscopy scale bars = 0.5 μm and 2 μm respectively.
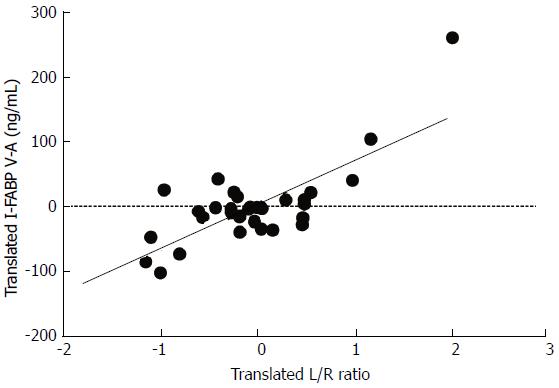
Figure 5 Translated values of plasma levels of I-FABP and translated values of L/R ratio’s in patients submitted to 30 min of ischemia followed by 30 and 120 min of reperfusion.
I-FABP correlated significantly with L/R ratio’s [correlation: 0.467, (P < 0.01)]. Translations of both variables are specific for an individual in such a way that all within-person means correspond to the zeros in the plot. In this way the variation of individual levels are cancelled and the pure association of both variables remains.
- Citation: Schellekens DH, Hundscheid IH, Leenarts CA, Grootjans J, Lenaerts K, Buurman WA, Dejong CH, Derikx JP. Human small intestine is capable of restoring barrier function after short ischemic periods. World J Gastroenterol 2017; 23(48): 8452-8464
- URL: https://www.wjgnet.com/1007-9327/full/v23/i48/8452.htm
- DOI: https://dx.doi.org/10.3748/wjg.v23.i48.8452


