Copyright
©The Author(s) 2017.
World J Gastroenterol. Dec 14, 2017; 23(46): 8235-8247
Published online Dec 14, 2017. doi: 10.3748/wjg.v23.i46.8235
Published online Dec 14, 2017. doi: 10.3748/wjg.v23.i46.8235
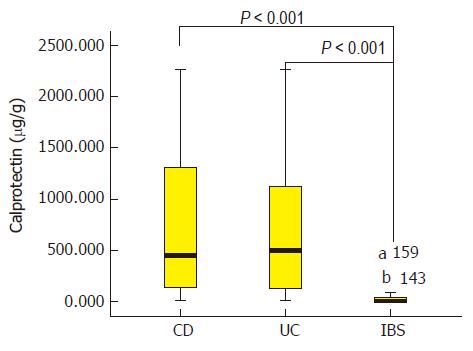
Figure 1 Median fecal calprotectin levels in Crohn’s disease, ulcerative colitis, and irritable bowel syndrome patients, illustrated by box plots.
The box indicates the lower and upper quartiles, and the horizontal line in the middle of the box is the median. The 95% confidence interval is indicated by the whiskers, and values outside the whiskers are individual outliers. FC: Fecal calprotectin; IBD: Inflammatory bowel disease; CD: Crohn’s disease; UC: Ulcerative colitis; a,b: the sample numbers of fecal calprotectin extreme values in box plot.
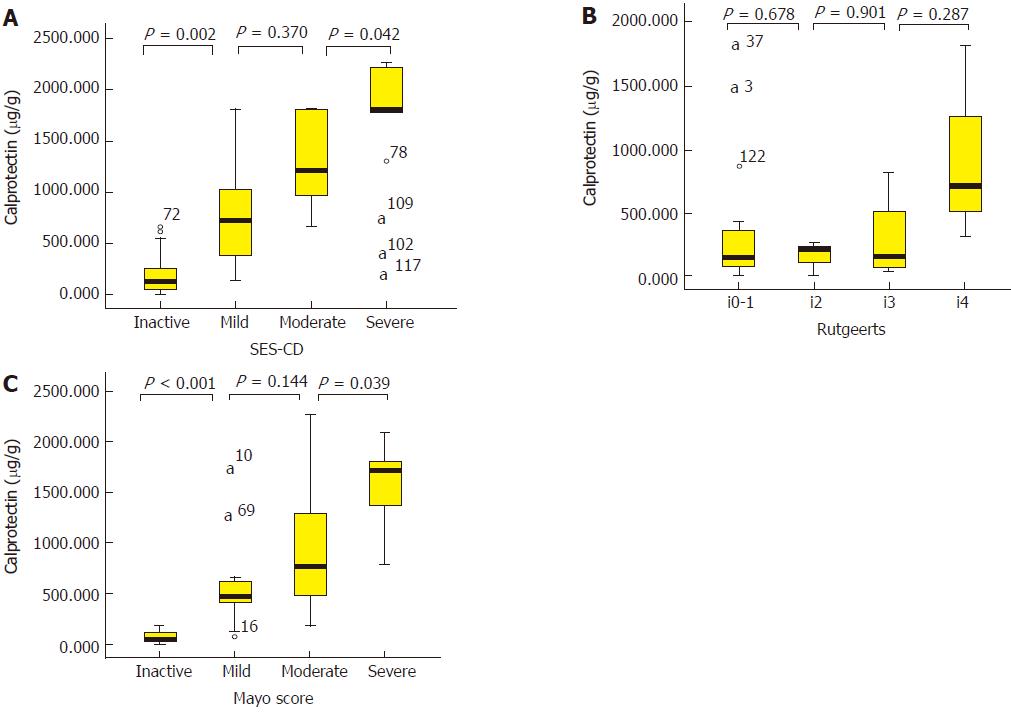
Figure 2 Median fecal calprotectin levels according to endoscopic activity grade in three subgroups of inflammatory bowel disease patients, illustrated by box plots.
A: The median FC levels in CICD patients grouped by SES-CD. B: The median FC levels in CD-related surgery patients grouped by Rutgeerts score. C: The median FC levels in UC patients grouped by Mayo score. a: the sample numbers of fecal calprotectin extreme values in box plots; FC: Fecal calprotectin; CD: Crohn’s disease; UC: Ulcerative colitis; CICD: Colonic or ileo-colonic Crohn’s disease; SES-CD: Simple endoscopic score for Crohn’s disease.
- Citation: Chen JM, Liu T, Gao S, Tong XD, Deng FH, Nie B. Efficacy of noninvasive evaluations in monitoring inflammatory bowel disease activity: A prospective study in China. World J Gastroenterol 2017; 23(46): 8235-8247
- URL: https://www.wjgnet.com/1007-9327/full/v23/i46/8235.htm
- DOI: https://dx.doi.org/10.3748/wjg.v23.i46.8235


