Copyright
©The Author(s) 2017.
World J Gastroenterol. Nov 28, 2017; 23(44): 7888-7898
Published online Nov 28, 2017. doi: 10.3748/wjg.v23.i44.7888
Published online Nov 28, 2017. doi: 10.3748/wjg.v23.i44.7888
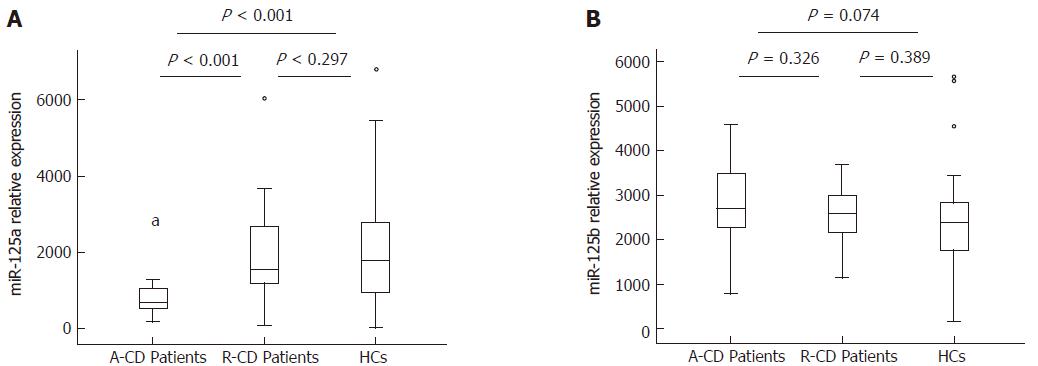
Figure 1 miR-125a/b expression in active Crohn's disease patients, patients with Crohn's disease in remission, and healthy controls.
miR-125a was decreased in A-CD patients compared with R-CD patients and HCs (A), while no differences in miR-125b were detected between groups. Comparison between two groups was performed by the Wilcoxon signed-rank test. P < 0.05 was considered significant. A-CD: Active Crohn's disease; R-CD: Crohn's disease in remission; HCs: Healthy controls.
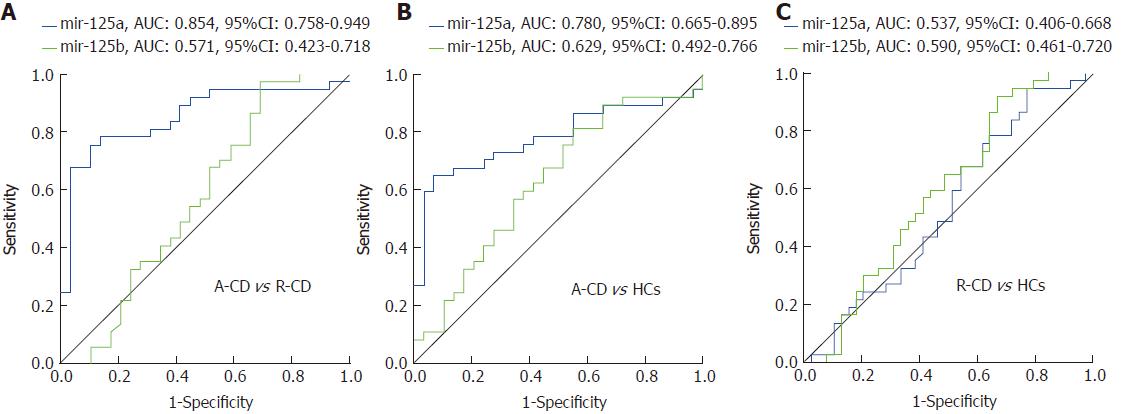
Figure 2 Receiver operating characteristic curve analysis of miR-125a/b for prediction of active Crohn's disease patients and patients with Crohn's disease in remission.
Receiver operating characteristic curve was operated to assess miR-125a/b expression in differentiating A-CD patients from R-CD patients and from HCs. miR-125a was able to differentiate A-CD patients from R-CD (A) patients and from HCs (B), whereas miR-125b was not (A, B). Neither miR-125a nor miR-125b could differentiate R-CD from HCs (C). A-CD: Active Crohn's disease; R-CD: Crohn's disease in remission; HCs: Healthy controls.
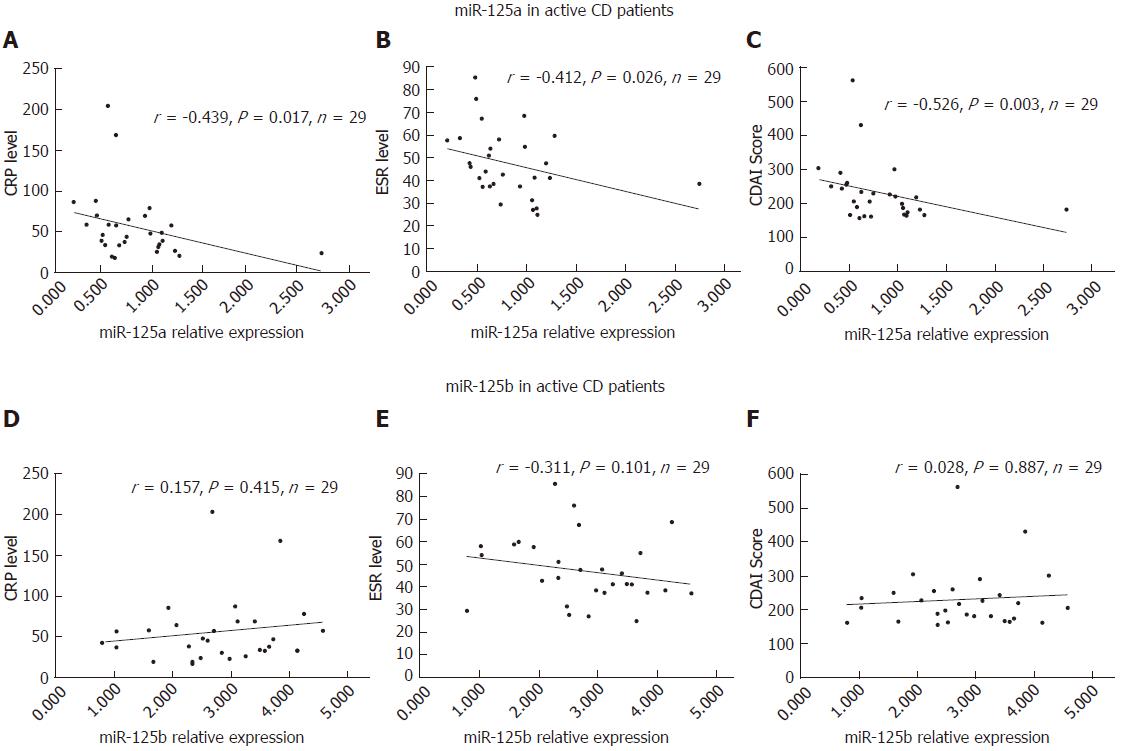
Figure 3 Correlations of miR-125a/b expression with disease severity in active Crohn's disease patients.
A-C: Correlations of miR-125a expression with disease severity in A-CD patients; D-F: Correlations of miR-125b expression with disease severity in A-CD patients. Spearman’s test was used to analyse the correlation of miR-125a/b expression with disease severity. P < 0.05 was considered significant. A-CD: Active Crohn's disease; R-CD: Crohn's disease in remission; HCs: Healthy controls.
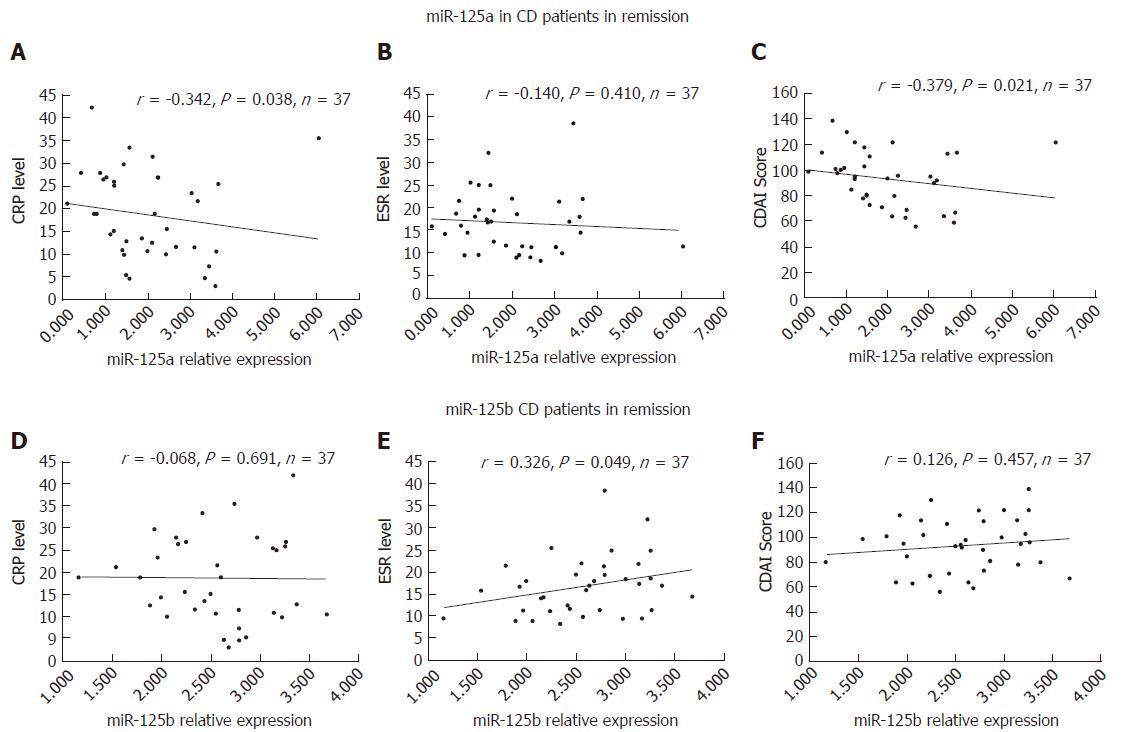
Figure 4 Correlations of miR-125a/b expression with disease severity in patients with Crohn's disease in remission.
A-C: Correlations of miR-125a expression with disease severity in R-CD patients; D-F: Correlations of miR-125b expression with disease severity in R-CD patients. Spearman’s test was used to analyse the correlation of miR-125a/b expression with disease severity. P < 0.05 was considered significant. A-CD: Active Crohn's disease; R-CD: Crohn's disease in remission; HCs: Healthy controls.
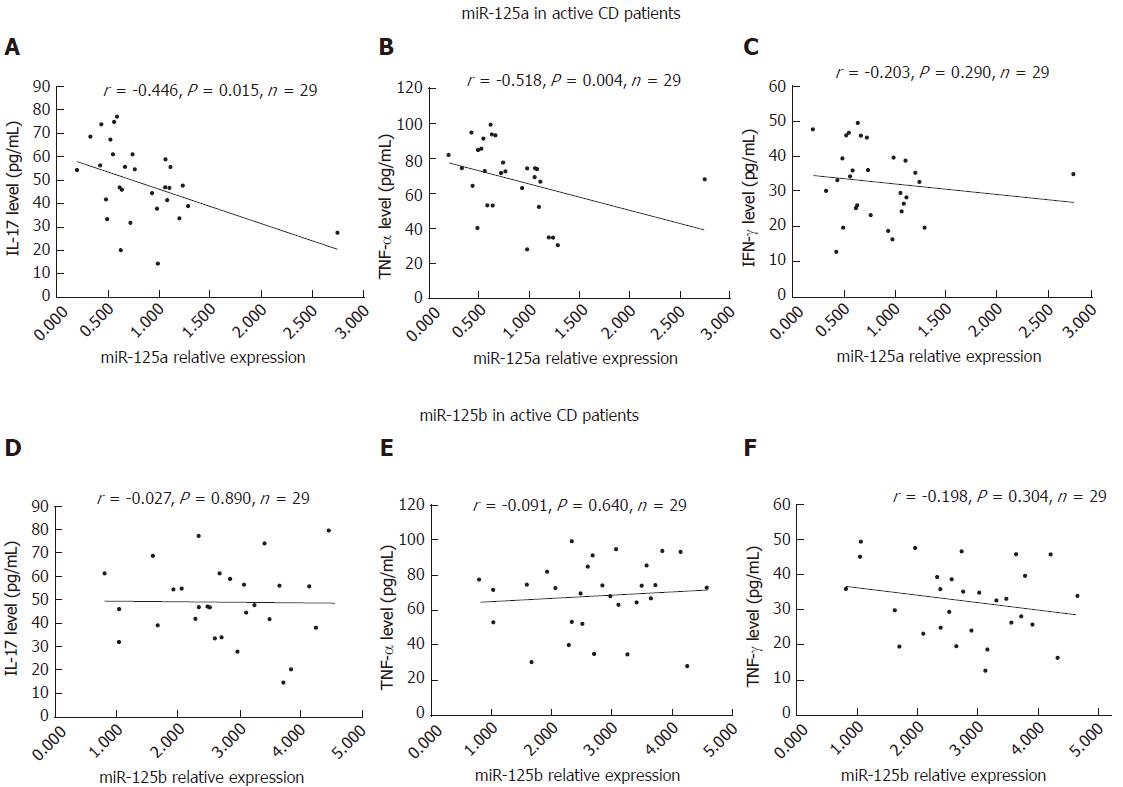
Figure 5 Correlations of miR-125a/b expression with inflammatory cytokines in active Crohn's disease patients.
A-C: Correlations of miR-125a expression with inflammatory cytokines in A-CD patients; D-F: Correlations of miR-125b expression with inflammatory cytokines in A-CD patients. Spearman’s test was used to analyse the correlation of miR-125a/b expression with inflammatory cytokines. P < 0.05 was considered significant. A-CD: Active Crohn's disease; R-CD: Crohn's disease in remission; HCs: Healthy controls.
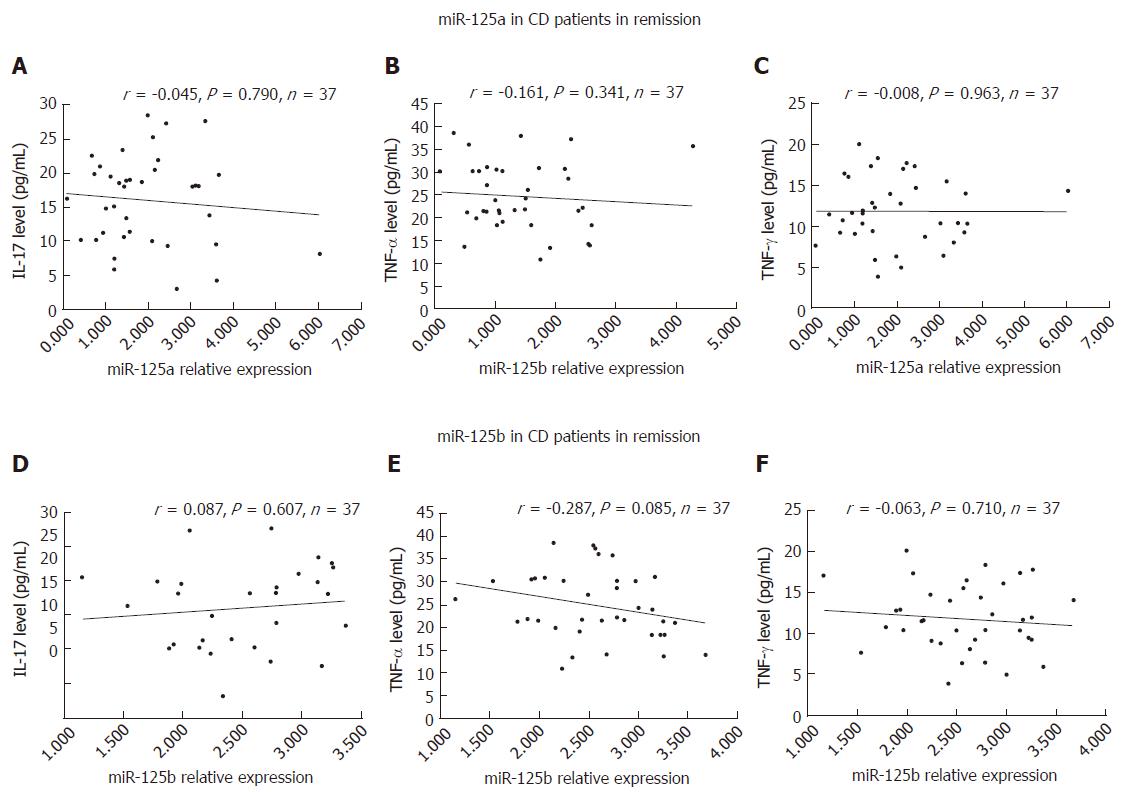
Figure 6 Correlations of miR-125a/b expression with inflammatory cytokines in patients with Crohn's disease in remission.
A-C: Correlations of miR-125a expression with inflammatory cytokines in R-CD patients; D-F: Correlations of miR-125b expression with inflammatory cytokines in R-CD patients. Spearman’s test was used to analyse the correlation of miR-125a/b expression with inflammatory cytokines. P < 0.05 was considered significant. A-CD: Active Crohn's disease; R-CD: Crohn's disease in remission; HCs: Healthy controls.
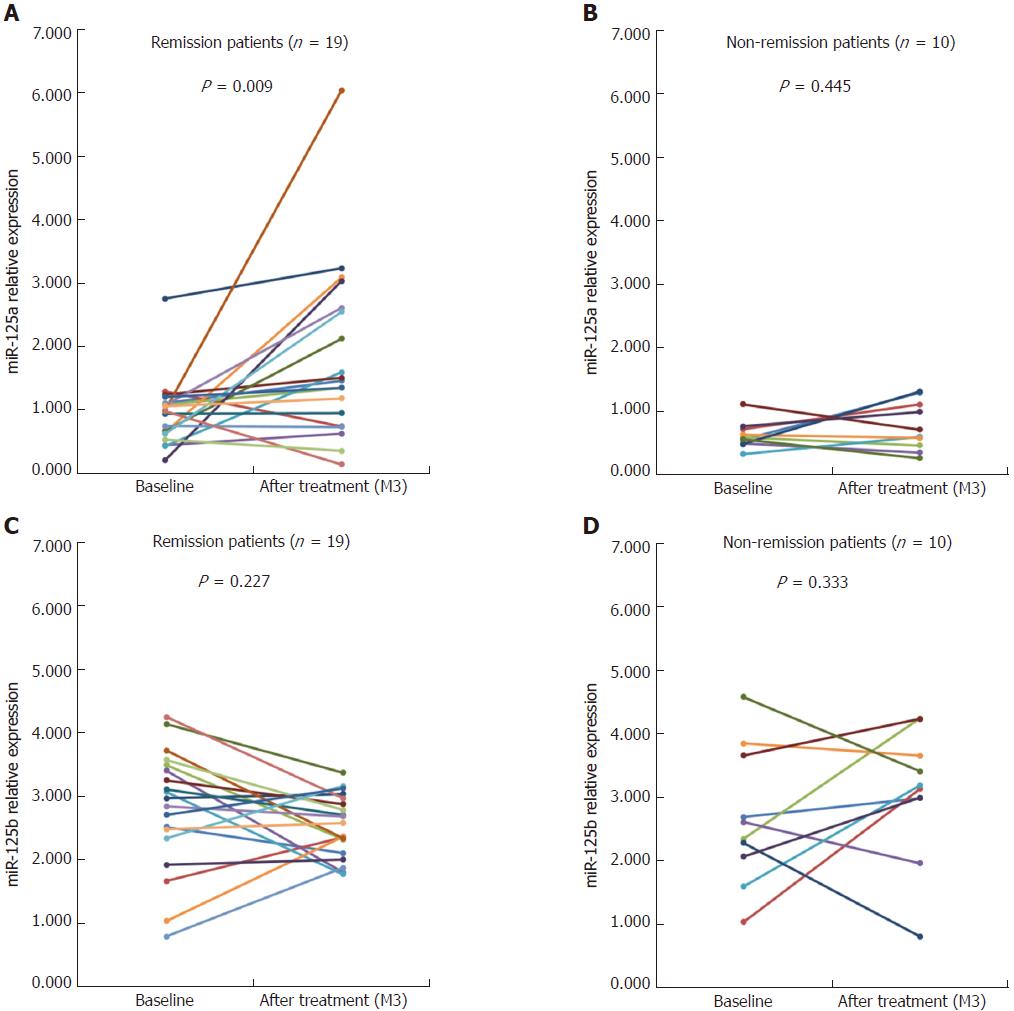
Figure 7 miR-125a/b expression in active Crohn's disease patients after treatment.
After 3-mo treatment, miR-125a expression was increased in A-CD patients who achieved clinical remission but remained stable in patients who failed to achieve remission. Conversely, no changes in miR-125b expression were observed in either remission or non-remission patients after 3-mo treatment. Comparison between visits in the same group was performed by the Wilcoxon signed-rank test. P < 0.05 was considered significant. A-CD: Active Crohn's disease.
- Citation: Sun CM, Wu J, Zhang H, Shi G, Chen ZT. Circulating miR-125a but not miR-125b is decreased in active disease status and negatively correlates with disease severity as well as inflammatory cytokines in patients with Crohn’s disease. World J Gastroenterol 2017; 23(44): 7888-7898
- URL: https://www.wjgnet.com/1007-9327/full/v23/i44/7888.htm
- DOI: https://dx.doi.org/10.3748/wjg.v23.i44.7888


