Copyright
©The Author(s) 2017.
World J Gastroenterol. Nov 21, 2017; 23(43): 7791-7806
Published online Nov 21, 2017. doi: 10.3748/wjg.v23.i43.7791
Published online Nov 21, 2017. doi: 10.3748/wjg.v23.i43.7791
Figure 1 Flow chart showing study retrieval and selection process.
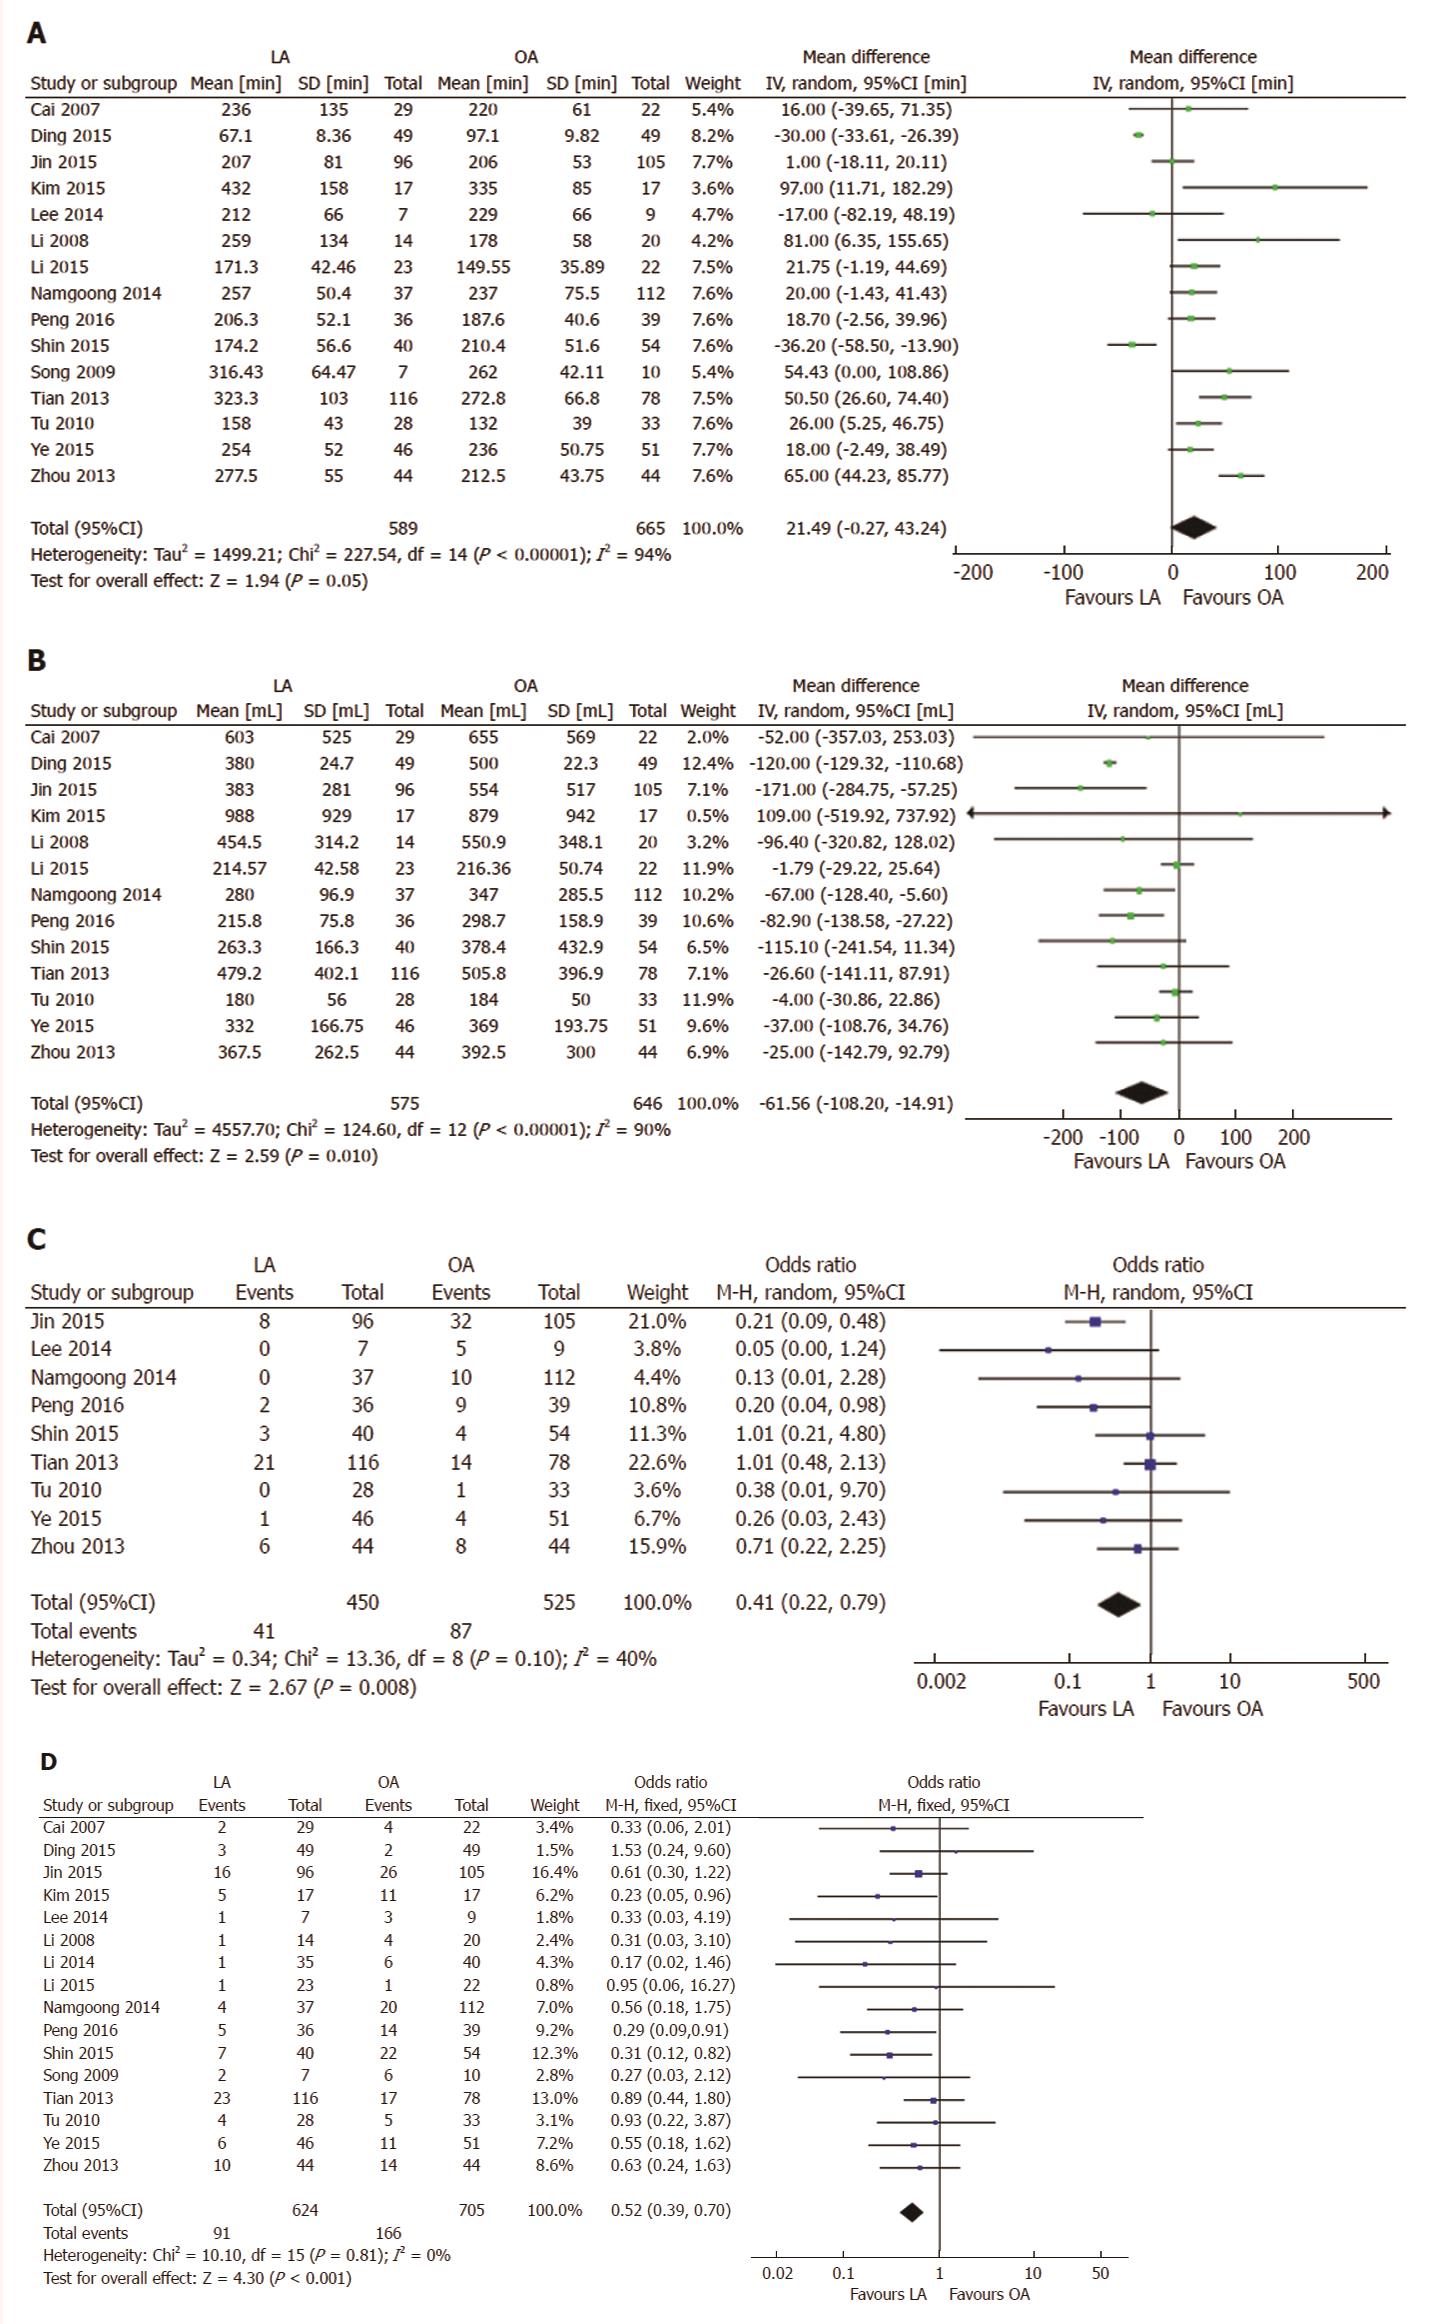
Figure 2 Forest plots comparing operative outcomes between laparoscopic and open liver resection for hepatolithiasis.
A: Operative time; B: Intraoperative blood loss; C: Intraoperative transfusion; D: Postoperative complications.
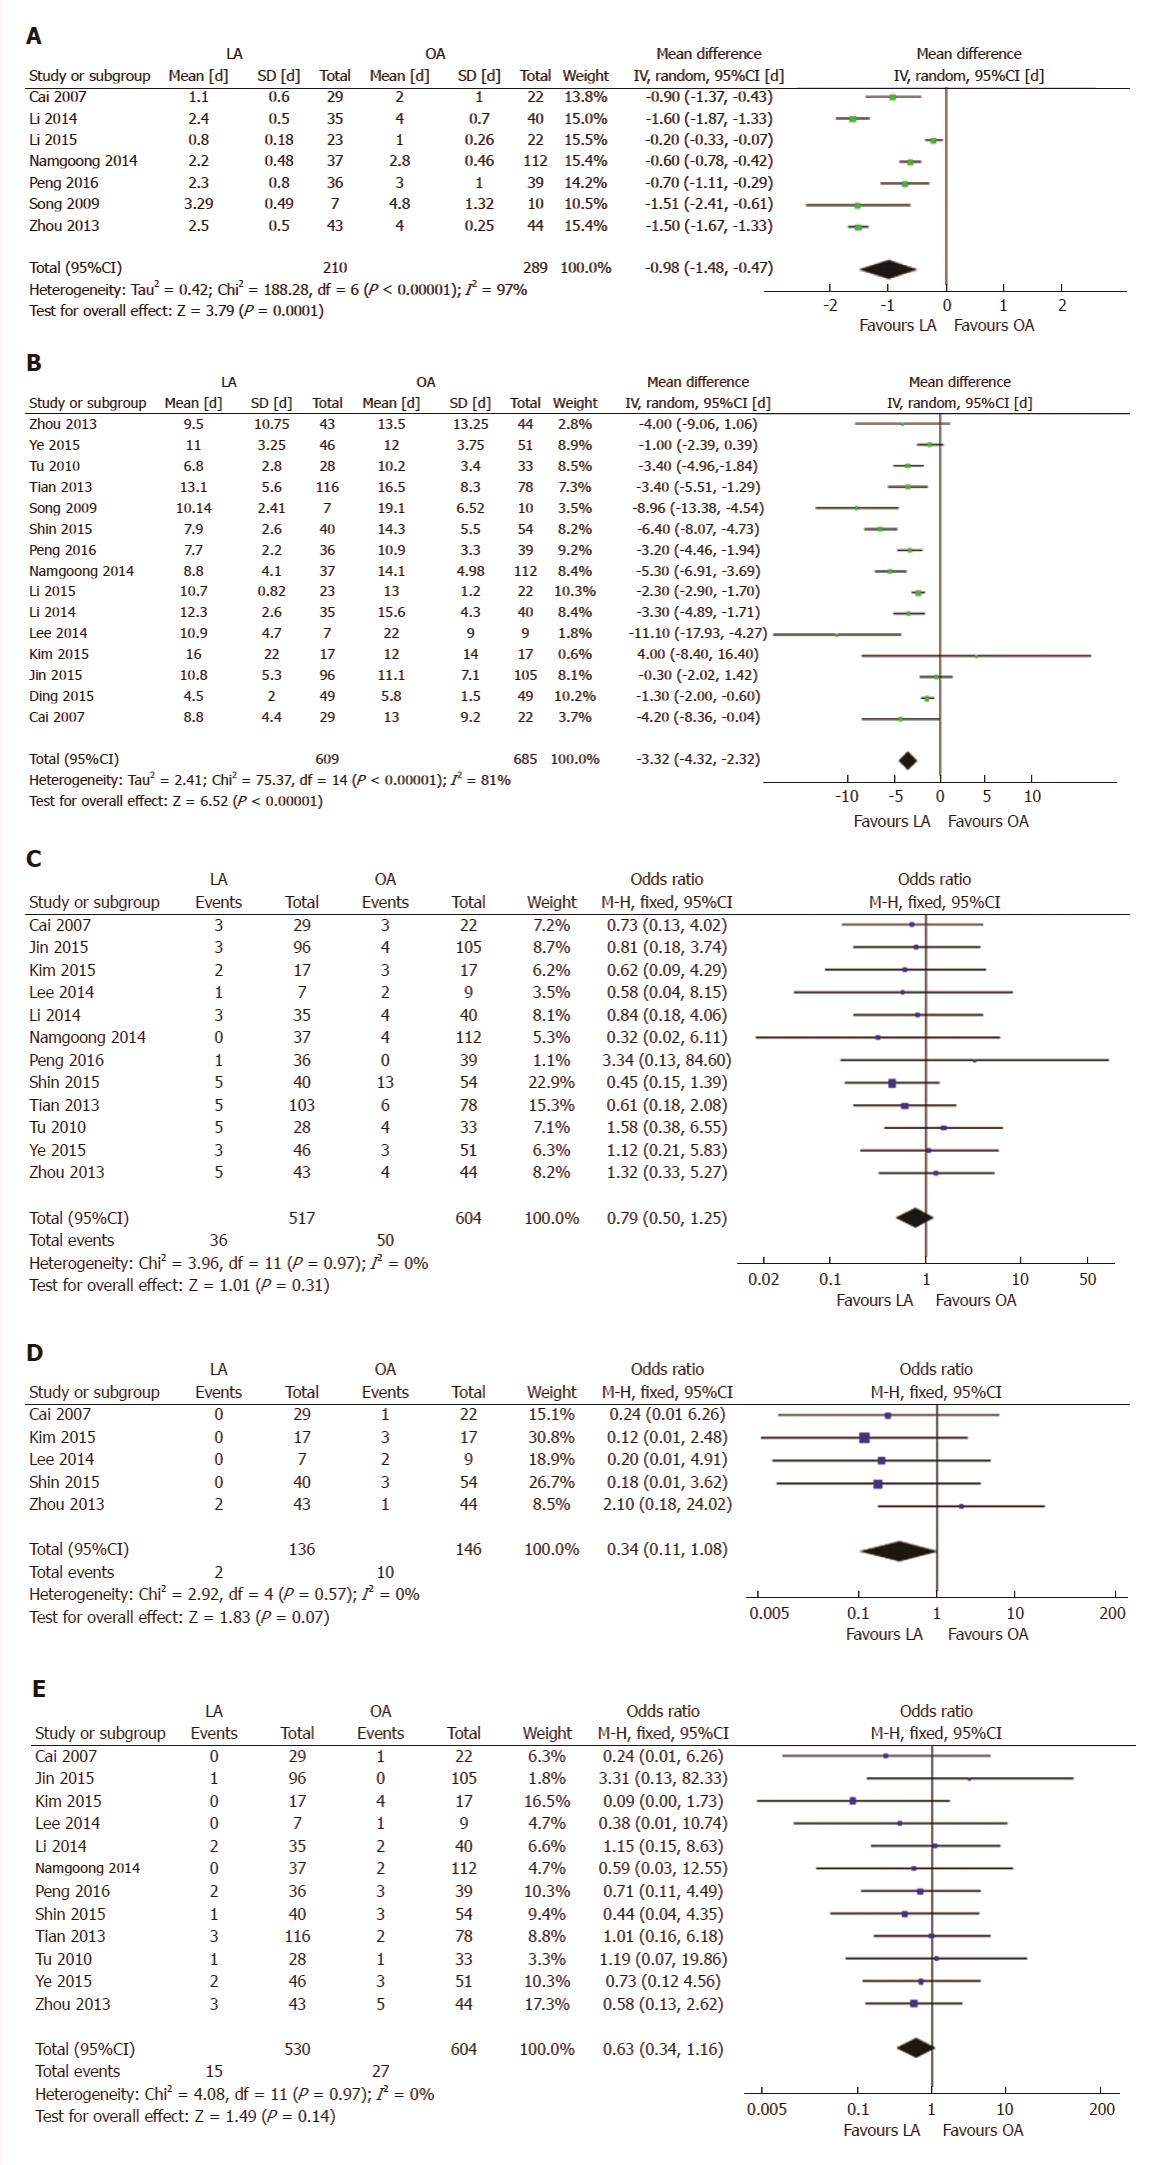
Figure 3 Forest plots comparing postoperative outcomes between laparoscopic and open liver resection for hepatolithiasis.
A: Time to oral intake; B: Length of postoperative hospital stay.
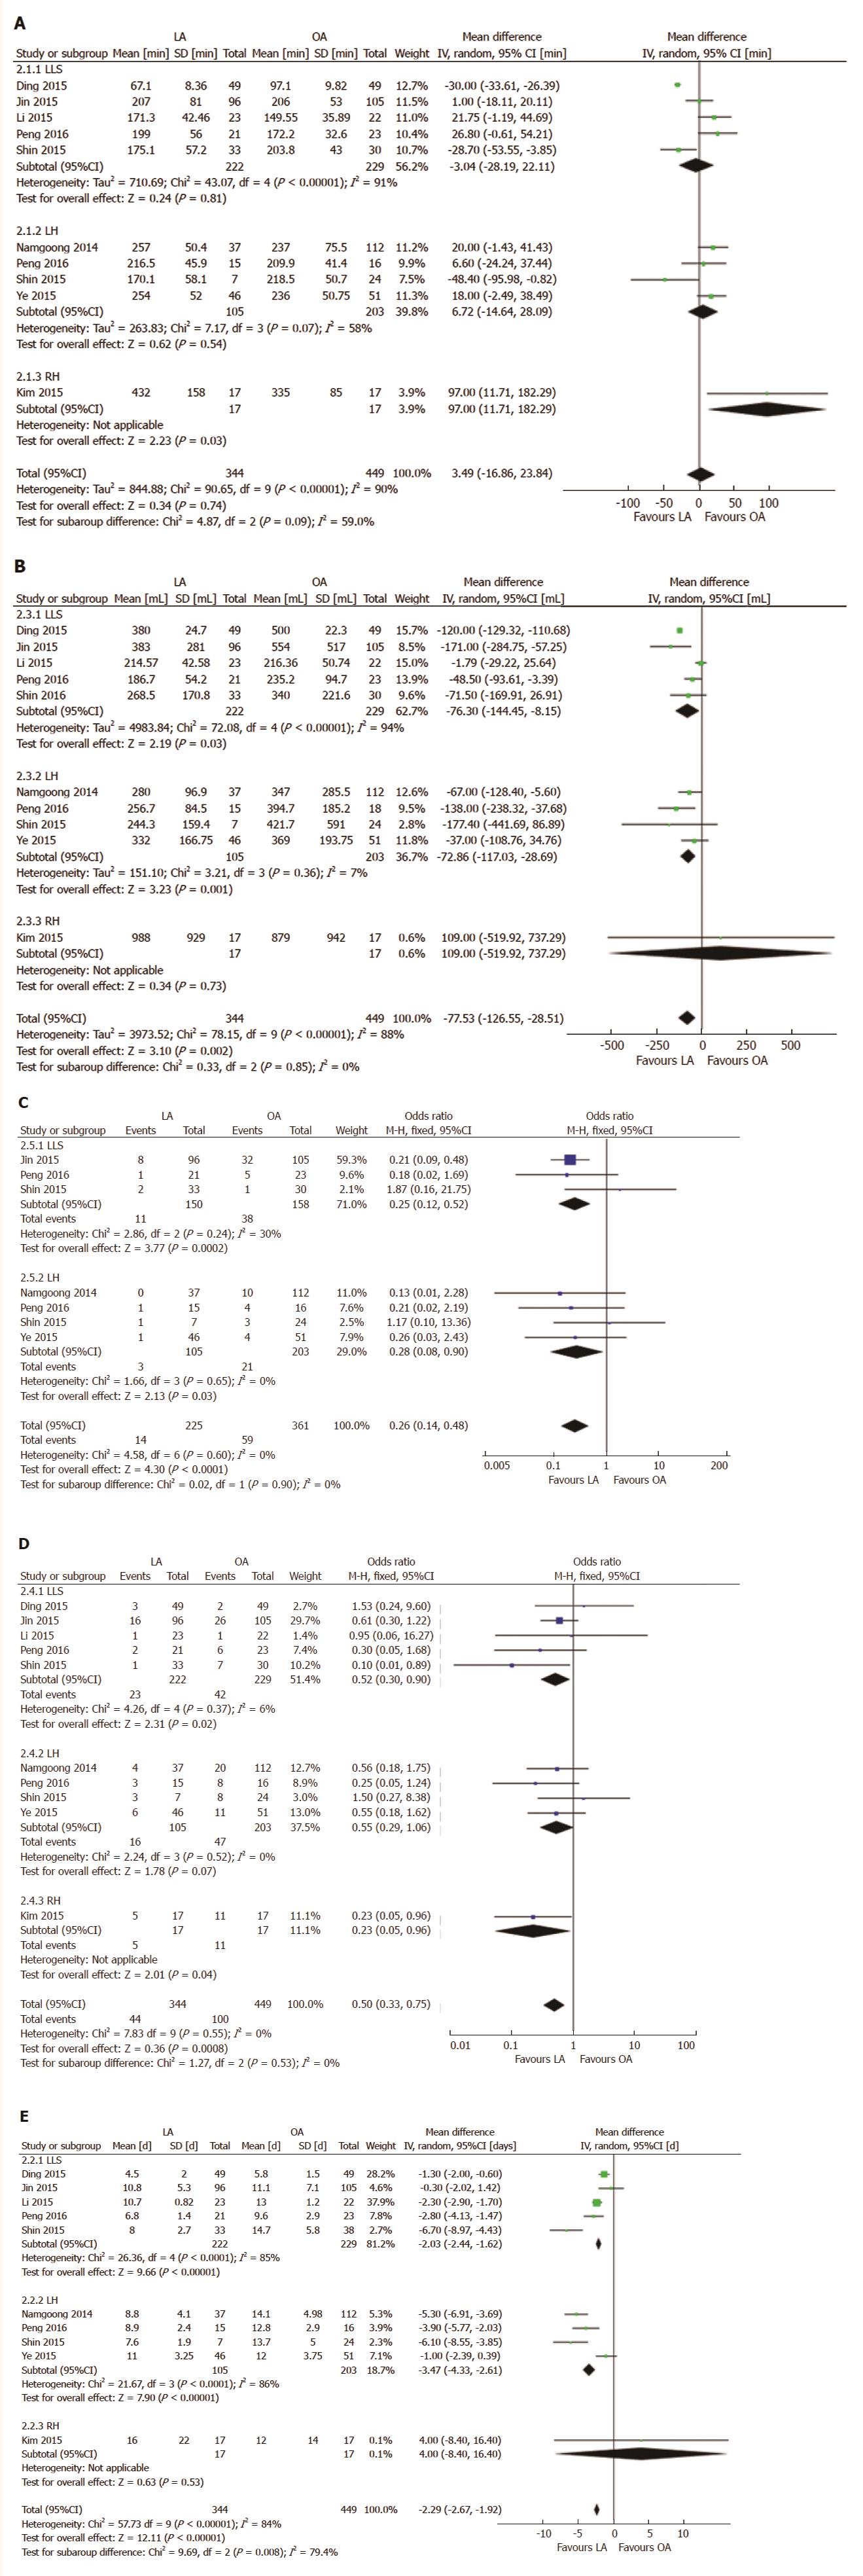
Figure 4 Forest plots and subgroup meta-analysis of operative time (A), blood loss during operation (B), intraoperative transfusion rate (C), postoperative complication rate (D) and length of hospital stay (E).
IV: Inverse variance method; LA: Laparoscopic approach; LH: Left hemihepatectomy; LLS: Left lateral sectionectomy; OA: Open approach; RH: Right hemihepatectomy; SD: Standard deviation.
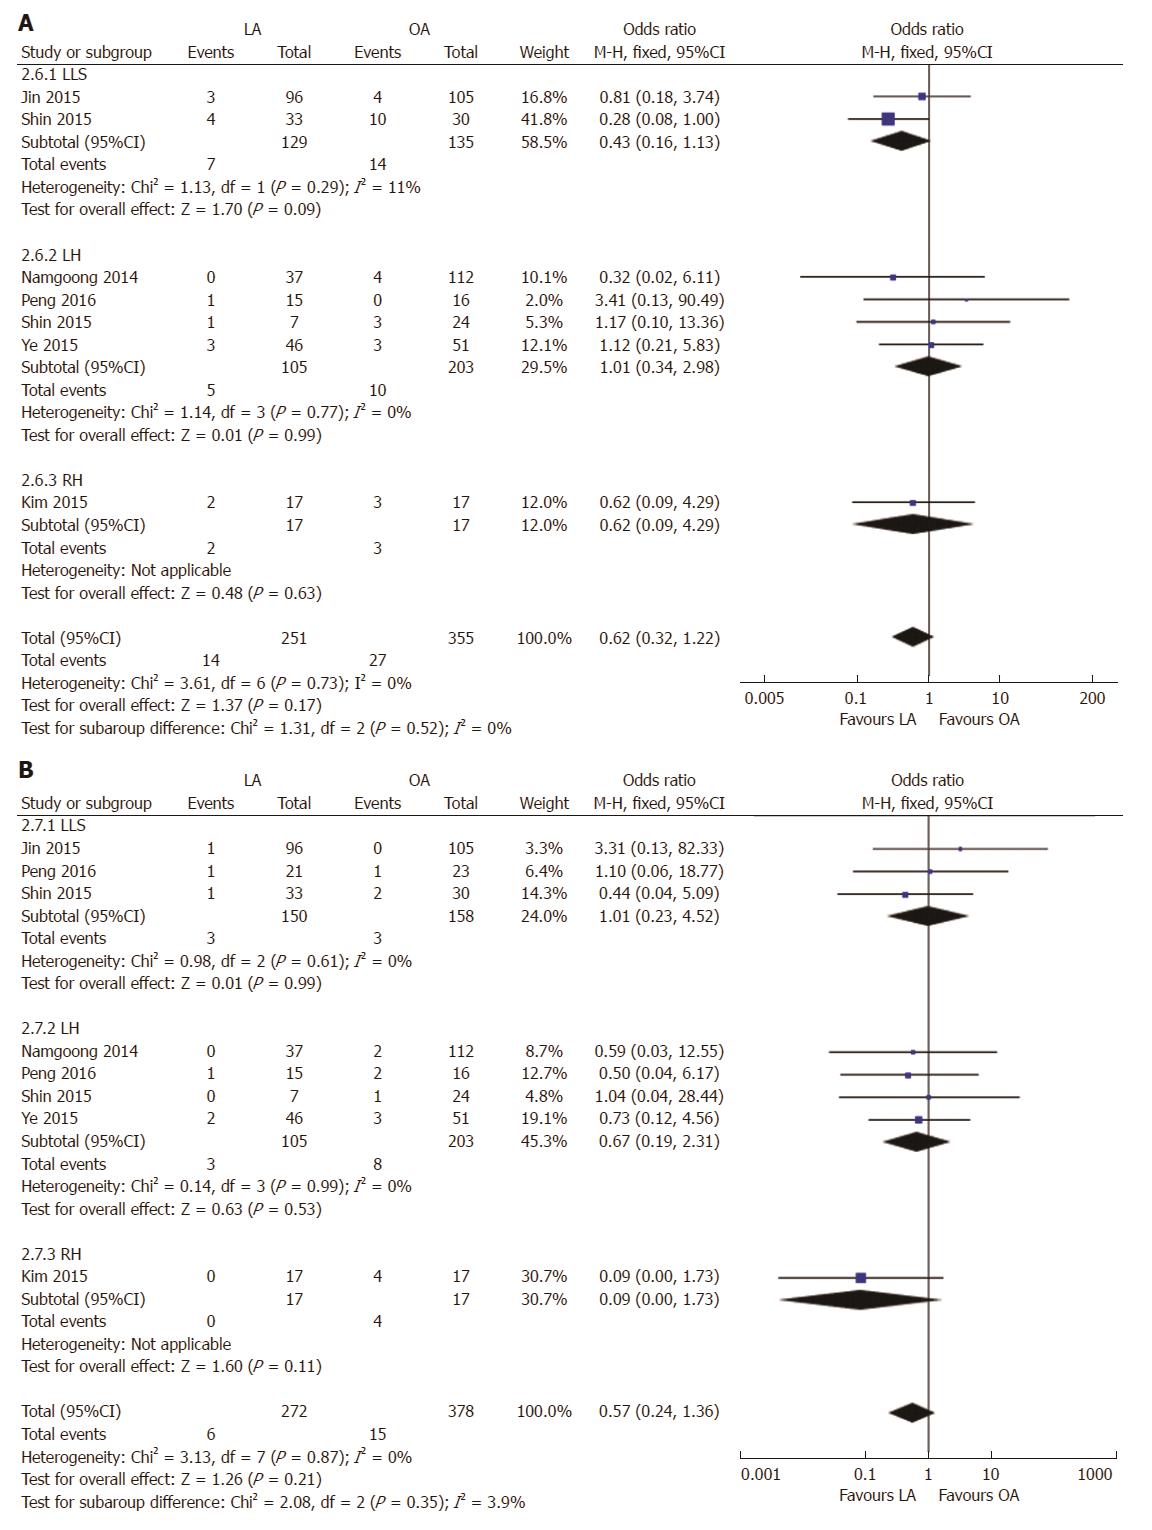
Figure 5 Forest plots and subgroup meta-analysis of initial residual stone rate (A) and stone recurrence rate (B).
IV: Inverse variance method; LA: Laparoscopic approach; LH: Left hemihepatectomy; LLS: Left lateral sectionectomy; OA: Open approach; RH: Right hemihepatectomy; SD: Standard deviation.
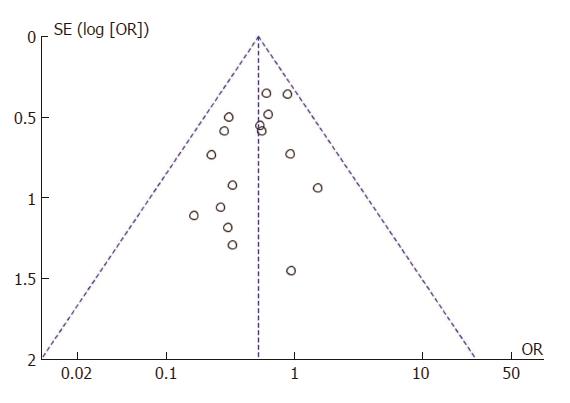
Figure 6 Funnel plot presenting meta-analysis of postoperative complication rate.
- Citation: Li H, Zheng J, Cai JY, Li SH, Zhang JB, Wang XM, Chen GH, Yang Y, Wang GS. Laparoscopic VS open hepatectomy for hepatolithiasis: An updated systematic review and meta-analysis. World J Gastroenterol 2017; 23(43): 7791-7806
- URL: https://www.wjgnet.com/1007-9327/full/v23/i43/7791.htm
- DOI: https://dx.doi.org/10.3748/wjg.v23.i43.7791


