Copyright
©The Author(s) 2017.
World J Gastroenterol. Nov 21, 2017; 23(43): 7735-7745
Published online Nov 21, 2017. doi: 10.3748/wjg.v23.i43.7735
Published online Nov 21, 2017. doi: 10.3748/wjg.v23.i43.7735
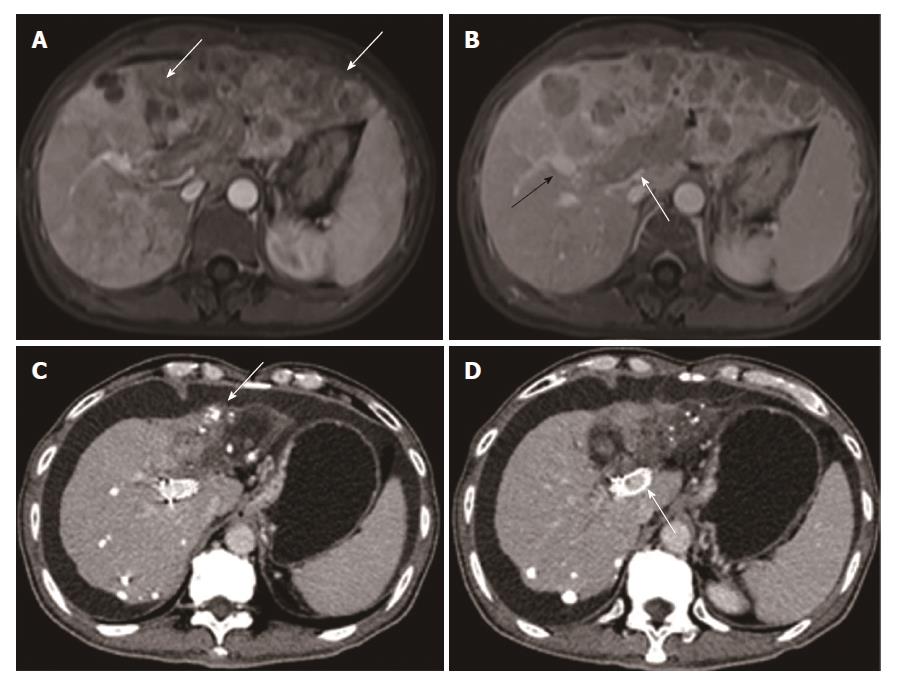
Figure 1 Images from a 50-year-old man who had hepatocellular carcinoma with main portal vein tumor thrombus.
A: Contrast-enhanced abdominal magnetic resonance imaging before therapy. Diffuse hepatocellular carcinoma (white arrow) was detected in the left lobe. B: The second order of the right portal vein (black arrow) was patent. Tumor thrombus (white arrow) was observed in the left portal vein, the first order of the right portal vein, and the main portal vein. C: Contrast-enhanced abdominal CT image 24 mo after first therapy. Deposition of iodized oil (white arrow) within tumor was observed and the left lobe was atrophied. D: The stent was still patent (white arrow).
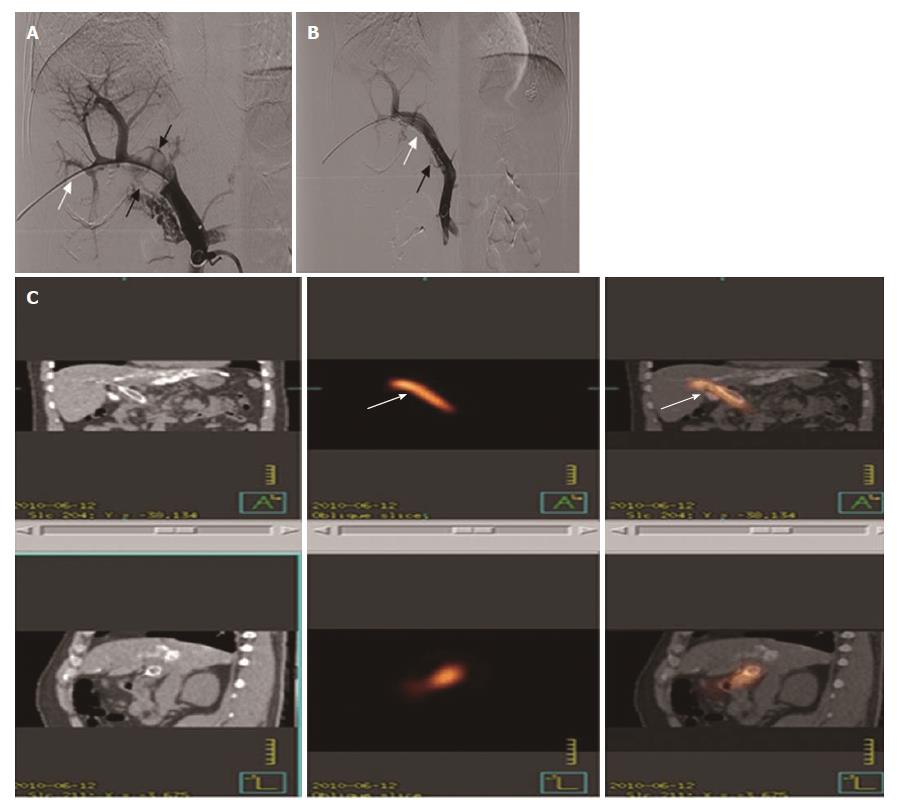
Figure 2 Images of iodine-125 seed strand and stent placement.
A: After the patent second-order branch of the left portal vein was catheterized, a 5-F calibrated pigtail catheter (white arrow) was placed in the splenic vein. Tumor thrombus (black arrows) in the proximal MPV and sagittal segment of right portal vein was shown clearly on portography, but the right portal vein did not develop. B: A 14-mm x 80-mm self-expandable stent (black arrow) and 125I seed strand (white arrow) with 20 seeds loaded were placed precisely in the obstructed MPV. C: Images of SPECT/CT scan 1 d after therapy. MPV: Main portal vein.
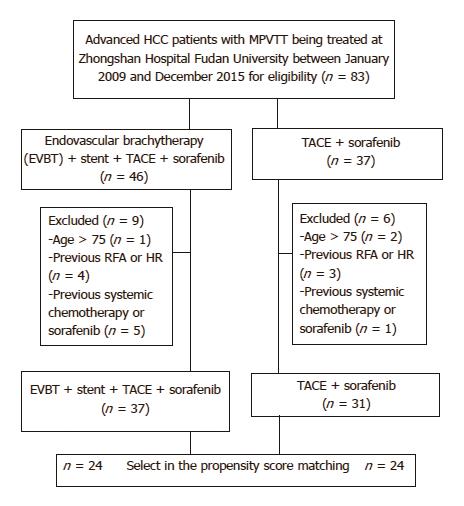
Figure 3 Patient selection and cohorting.
MPVTT: Main portal vein tumor thrombus; HCC: Hepatocellular carcinoma; TACE: Transarterial chemoembolization; EVBT: Endovascular brachytherapy.
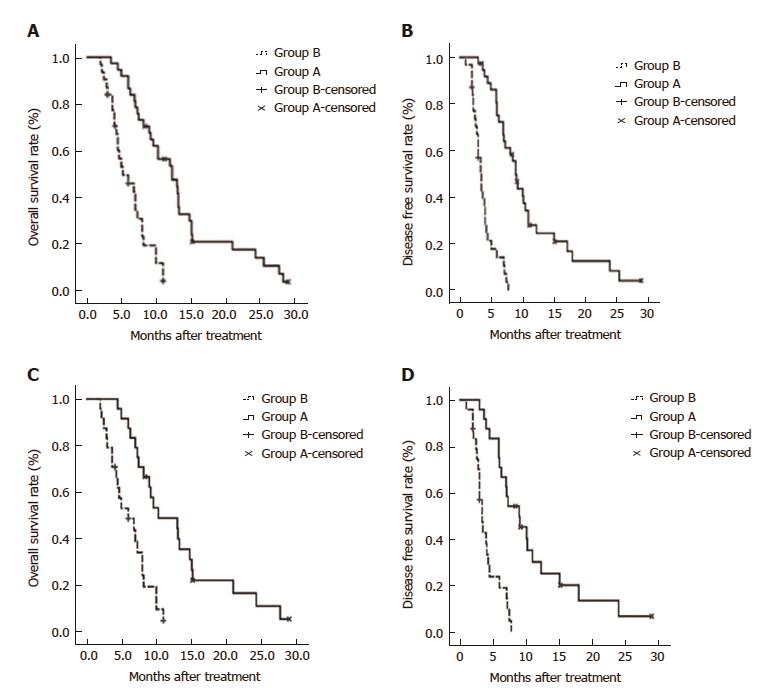
Figure 4 Overall survival of the overall cohort and matched cohort.
A: Kaplan-Meier curves for the overall patient cohort. OS differed between the two groups (OS, 12.3 vs 5.2 mo; P < 0.001); B: Kaplan-Meier curves for disease free survival in the overall patient cohort. C: Kaplan-Meier curves for OS in propensity score-matched patiens. Median OS was longer in group A than in group B (10.3 vs 6.0 mo; P < 0.001); D: Kaplan-Meier curves for disease free survival in propensity score-matched
- Citation: Zhang ZH, Liu QX, Zhang W, Ma JQ, Wang JH, Luo JJ, Liu LX, Yan ZP. Combined endovascular brachytherapy, sorafenib, and transarterial chemobolization therapy for hepatocellular carcinoma patients with portal vein tumor thrombus. World J Gastroenterol 2017; 23(43): 7735-7745
- URL: https://www.wjgnet.com/1007-9327/full/v23/i43/7735.htm
- DOI: https://dx.doi.org/10.3748/wjg.v23.i43.7735


