Copyright
©The Author(s) 2017.
World J Gastroenterol. Nov 14, 2017; 23(42): 7618-7625
Published online Nov 14, 2017. doi: 10.3748/wjg.v23.i42.7618
Published online Nov 14, 2017. doi: 10.3748/wjg.v23.i42.7618
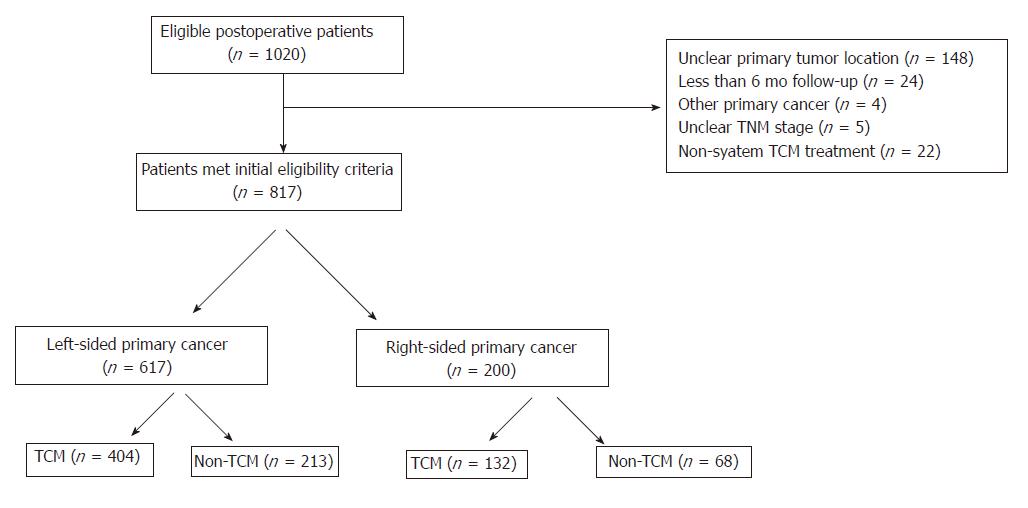
Figure 1 Flowchart of patient selection and grouping.
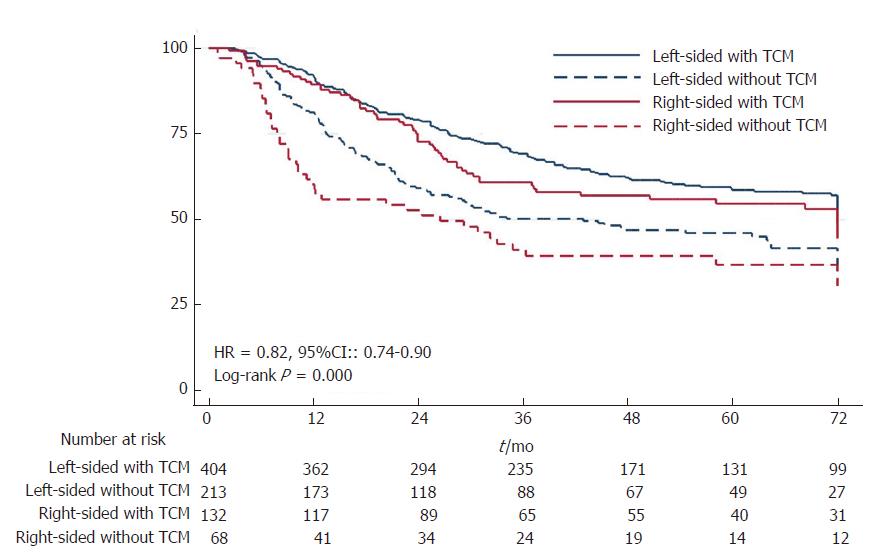
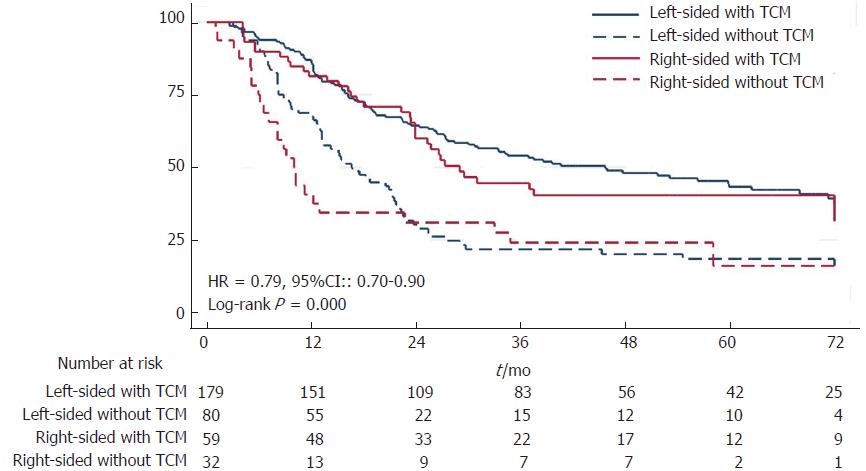
Figure 2 Kaplan-Meier disease-free survival curves for all patients.
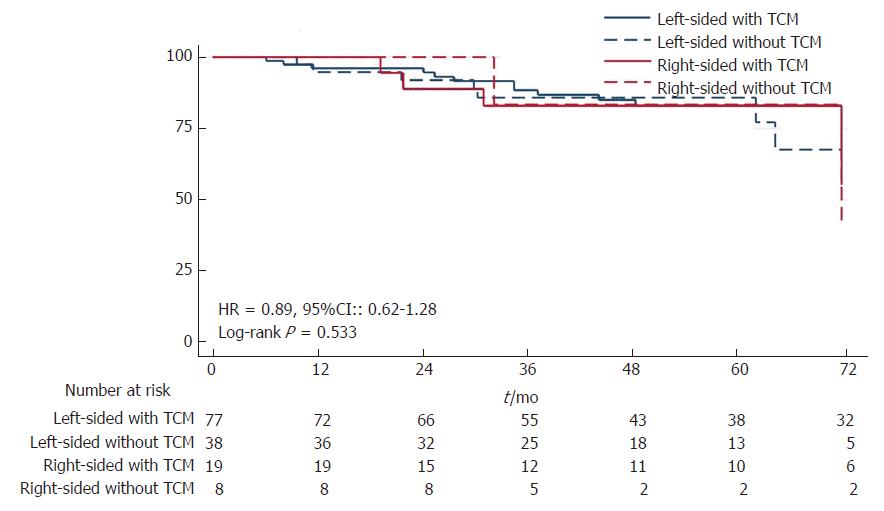
Figure 3 Kaplan-Meier disease-free survival curves for patients with stage I disease.
Figure 4 Kaplan-Meier disease-free survival curves for patients with stage II disease.
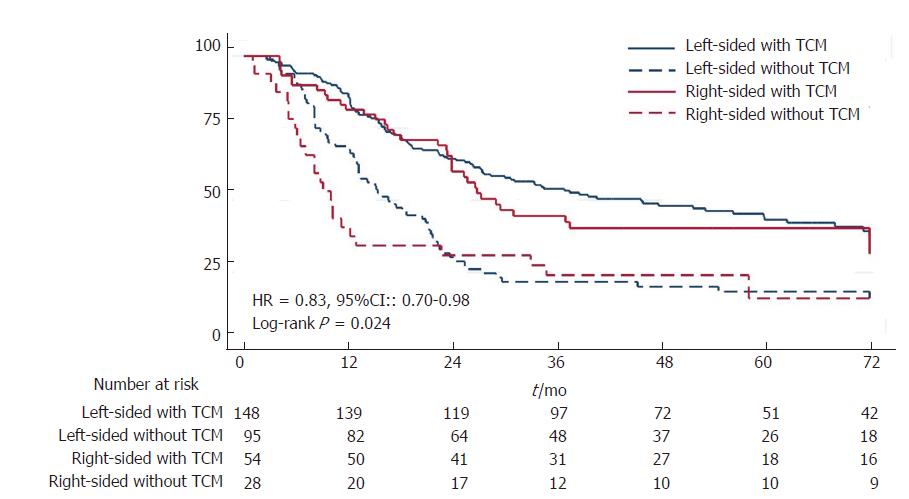
Figure 5 Kaplan-Meier disease-free survival curves for patients with stage III disease.
- Citation: Liu SS, Shi Q, Li HJ, Yang W, Han SS, Zong SQ, Li W, Hou FG. Right- and left-sided colorectal cancers respond differently to traditional Chinese medicine. World J Gastroenterol 2017; 23(42): 7618-7625
- URL: https://www.wjgnet.com/1007-9327/full/v23/i42/7618.htm
- DOI: https://dx.doi.org/10.3748/wjg.v23.i42.7618


