Copyright
©The Author(s) 2017.
World J Gastroenterol. Nov 14, 2017; 23(42): 7594-7608
Published online Nov 14, 2017. doi: 10.3748/wjg.v23.i42.7594
Published online Nov 14, 2017. doi: 10.3748/wjg.v23.i42.7594
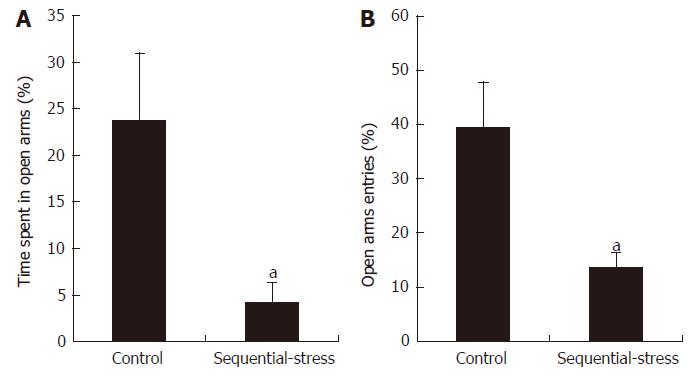
Figure 1 Elevated plus maze examination showed the sequential-stress-treated rats demonstrated anxiety-like behavior.
A: They spent less time in the open arms; B: They made fewer entries into the open arms. Data were expressed as the mean ± SEM of the percentage of time spent in open arms and open arms entries (n = 8 in each group). aP < 0.05 vs control.
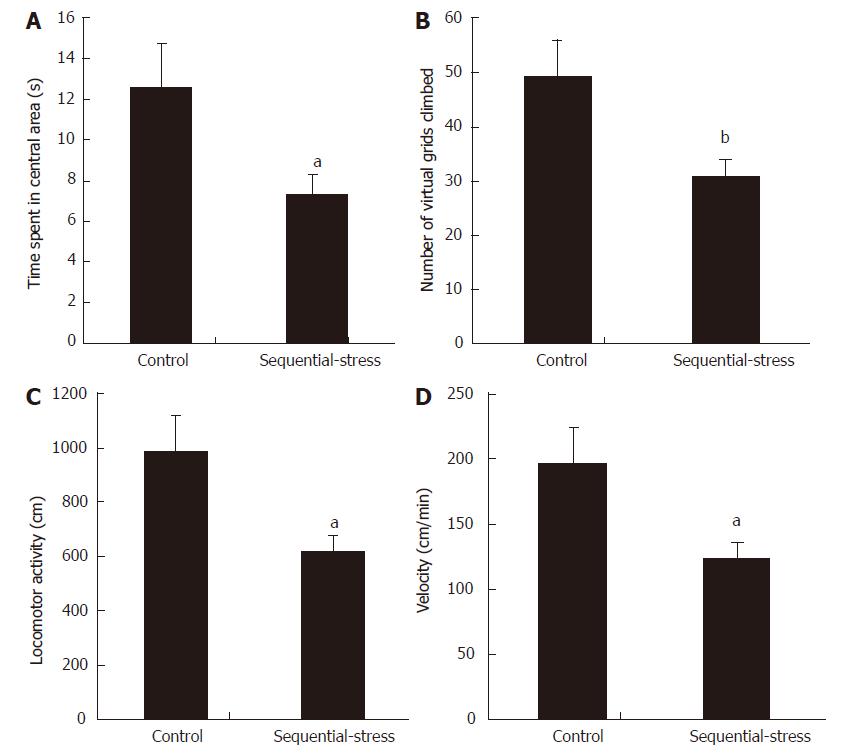
Figure 2 OF test showed the sequential-stress-treated rats demonstrated anxiety-like behavior.
A: They spent less time in central area; B: They climbed fewer number of virtual grids in OF box; C: Their total exploring distance was shorter; D: Their mean moving speed was slower. Data were expressed as the mean ± SEM of the time spent in central area, number of virtual grids climbed, total exploring distance and mean moving speed (n = 8 in each group). aP < 0.05, bP < 0.01 vs control group.
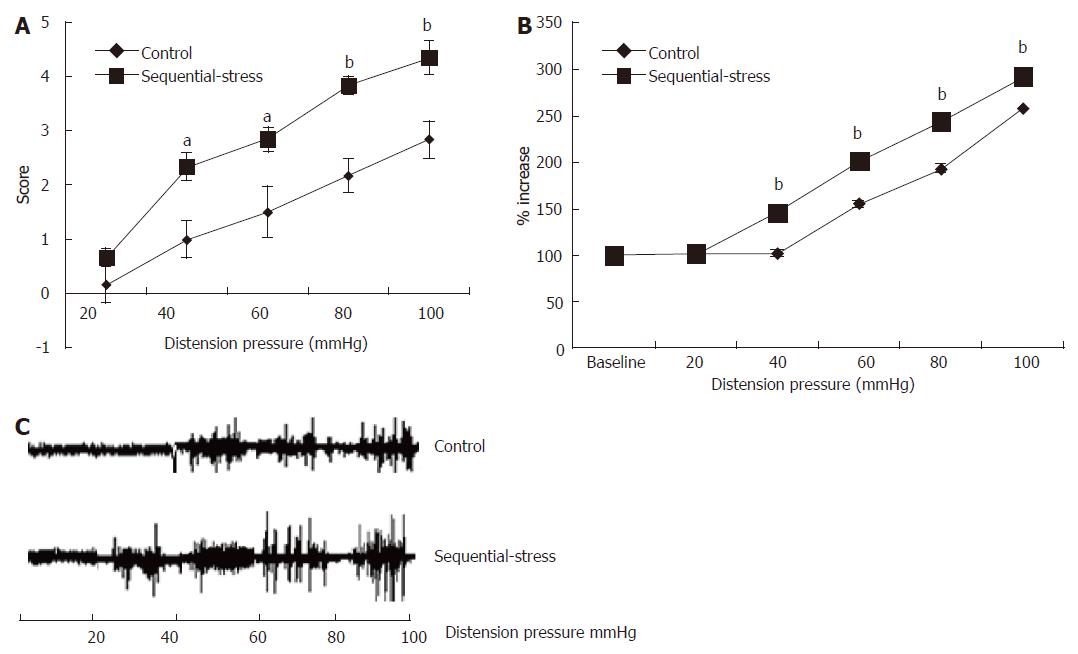
Figure 3 Abdominal withdrawal reflex and electromyographic tests showed the sequential-stress-treated rats exhibited gastric hypersensitivity to gastric distention.
A: AWR to GD of the sequential-stress-treated rats was significantly higher at the distention pressure 40, 60, 80 and 100 mmHg; B: EMG responses of the sequential-stress-treated rats were greater at the distention pressure 40, 60, 80 and 100 mmHg; C: The representative EMG response from both an adult sequential-stress-treated rat and control rat to GD. Data were expressed as the mean ± SEM of the AWR score and the percentage of EMG derived AUC increased (n = 8 in each group). aP < 0.05, bP < 0.01 vs control group.
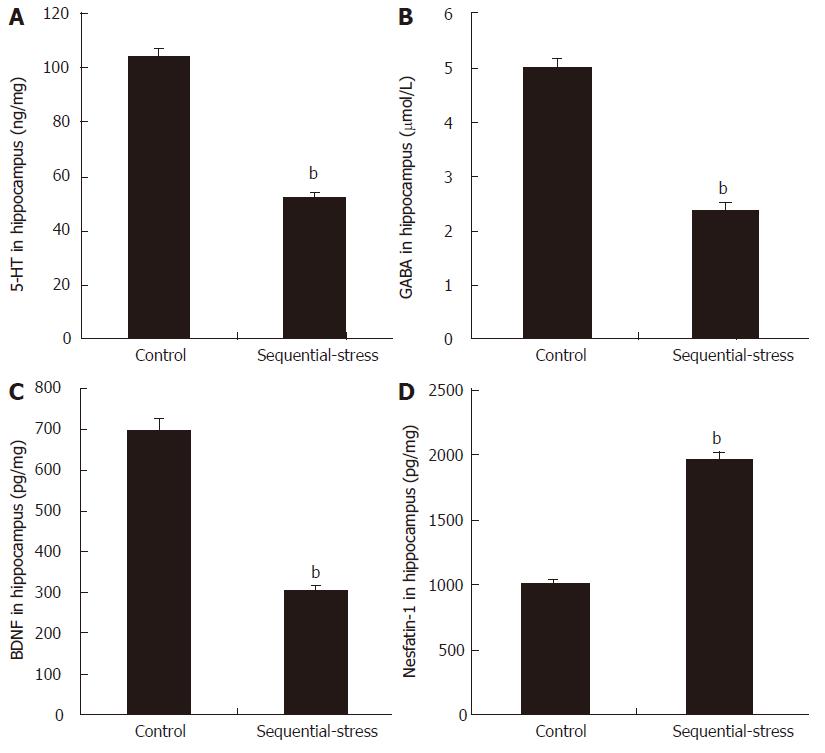
Figure 4 Influence of sequential stress on the levels of 5-hydroxytryptamine, γ-aminobutyric acid, brain-derived neurotrophic factor and nesfatin-1 in hippocampus.
A: 5-hydroxytryptamine (5-HT); B: γ-aminobutyric acid (GABA); and C: brain-derived neurotrophic factor (BDNF) were significantly down-regulated; D: Nesfatin-1 was significantly up-regulated. Data were expressed as the mean ± SEM of the levels of 5-HT, GABA, BDNF and Nesfatin-1 in Hippocampus (n = 8 in each group). bP < 0.01 vs control group.
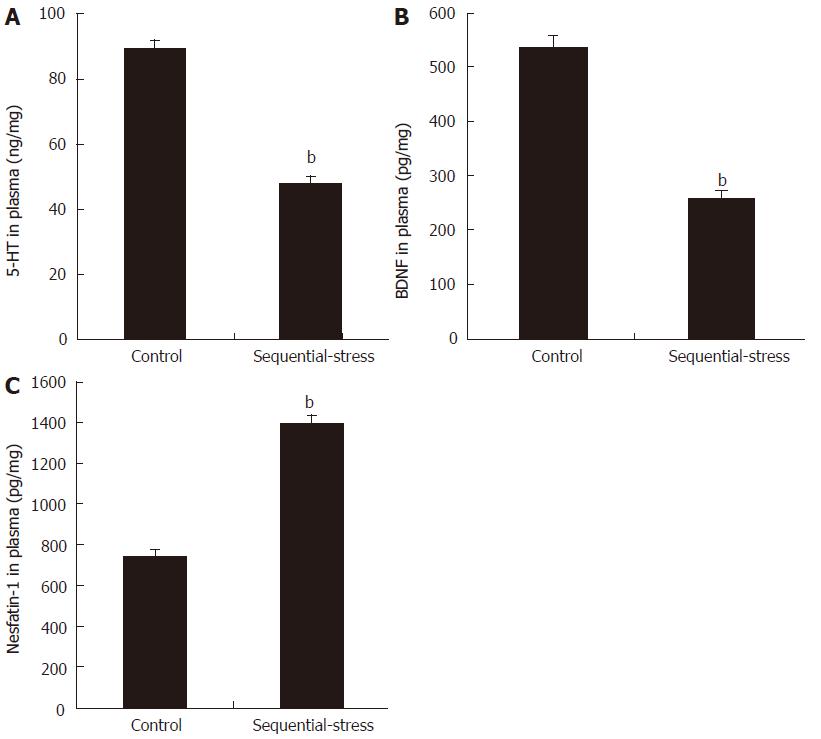
Figure 5 Influence of sequential stress on the levels of 5-hydroxytryptamine, brain-derived neurotrophic factor and nesfatin-1 in plasma.
A: 5-hydroxytryptamine (5-HT) and B: Brain-derived neurotrophic factor (BDNF) was significantly down-regulated; C: Nesfatin-1 was significantly up-regulated. Data were expressed as the mean ± SEM of the levels of 5-HT, BDNF and Nesfatin-1 in plasma (n = 8 in each group). bP < 0.01 vs control group.
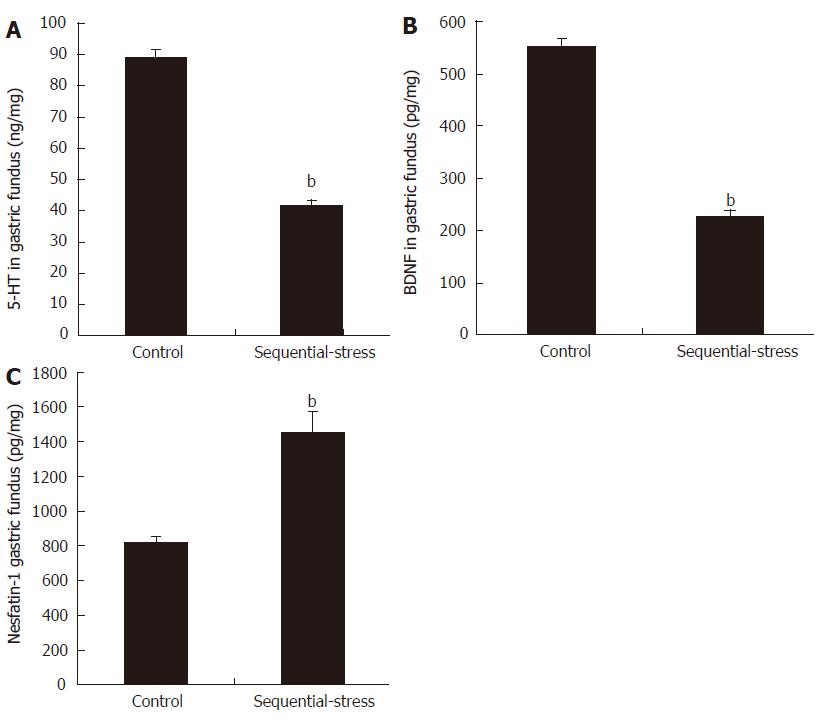
Figure 6 Influence of sequential stress on the levels of 5-hydroxytryptamine, brain-derived neurotrophic factor and nesfatin-1 in gastric fundus.
A: 5-hydroxytryptamine (5-HT) and B: Brain-derived neurotrophic factor (BDNF) were significantly down-regulated; C: Nesfatin-1 was significantly up-regulated. Data were expressed as the mean ± SEM of the levels of 5-HT, BDNF and Nesfatin-1 in gastric fundus (n = 8 in each group). bP < 0.01 vs control group.
Figure 7 Presentation of 5-hydroxytryptamine 1A receptor expression in the hippocampal CA1 subfield and the mucosa of gastric fundus of each group by immunohistochemistry.
A: Magnification, hippocampus, × 400 and gastric fundus, × 100; B: Level of 5-hydroxytryptamine 1A receptor (5-HT1AR) in hippocampus; C: Level of 5-HT1AR in gastric fundus. Data were expressed as the mean ± SEM of the levels of 5HT1AR (n = 8 in each group). aP < 0.05 vs control group.
Figure 8 Western blot detection showed a significant decrease of the level of 5-hydroxytryptamine 1A receptor in the hippocampal CA1 subfield of the sequential-stress-treated rats.
Data were expressed as the mean ± SEM of the levels of 5-hydroxytryptamine 1A receptor (5-HT1AR) (n = 8 in each group). bP < 0.01 vs control group.
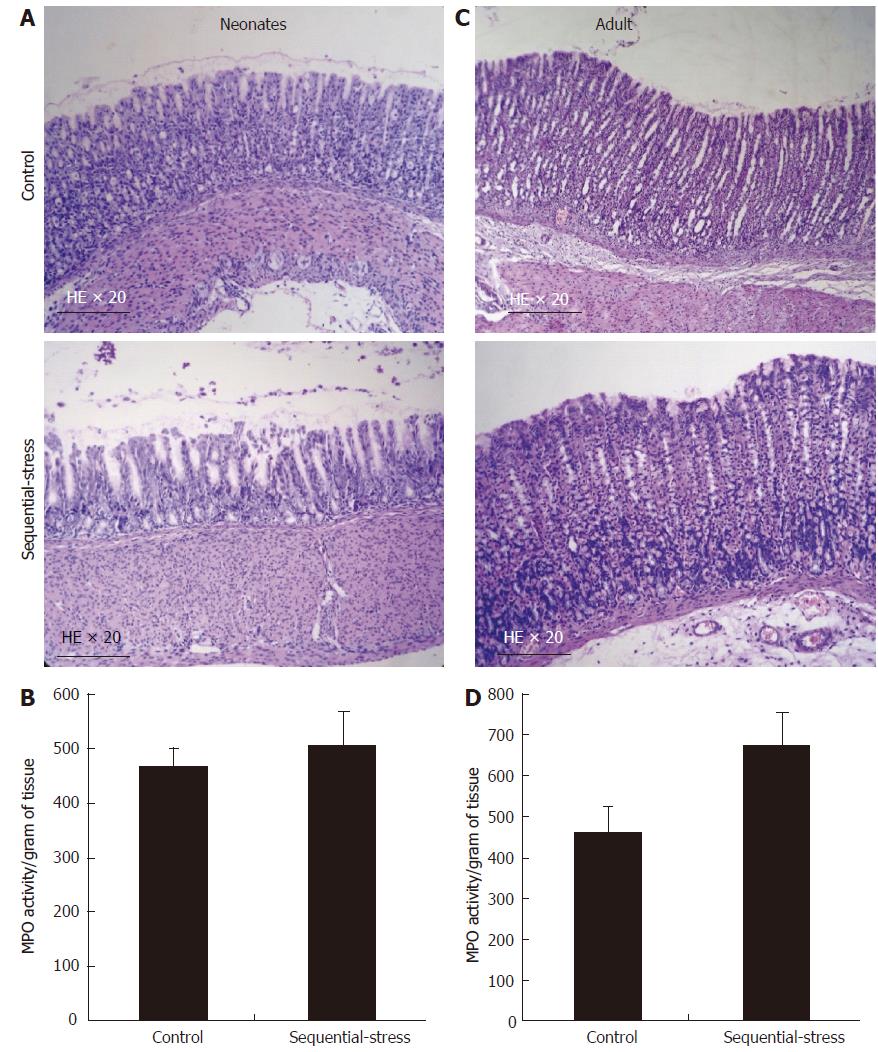
Figure 9 Influence of the sequential stress on inflammatory response of gastric mucosa.
A: On day 6 in early life only superficial sloughing of the mucosa was observed in the sequential-stress-treated group; B: Myeloperoxidase (MPO) activity assay at the same time demonstrated no statistical significance between two groups; C and D: after RS treatment, both histology and MPO activity test display no lesion or abnormality in the gastric mucosa of the two groups. MPO activity is represented as activity per unit of dry weight. Data were expressed as the mean ± SEM of the MPO activity (n = 8 in each group).
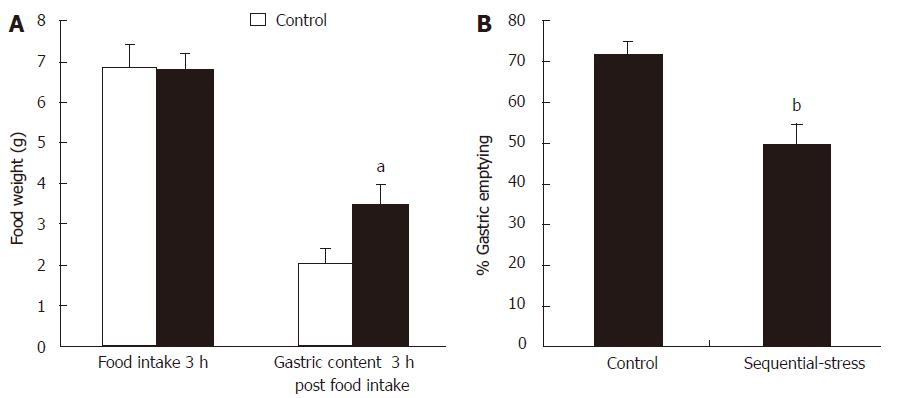
Figure 10 Influence of sequential stress on the rate of gastric emptying.
A: Although the food intake in 3 hours after 18 h fast were similar between the two groups, the gastric contents 3 h post food intake in sequential-stress-treated rats increased; B: the rate of gastric emptying of the food ingested in sequential-stress-treated rats decreased. Data were expressed as the mean ± SEM of the food weight and the rate of gastric emptying (n = 8 in each group). aP < 0.05, bP < 0 .01 vs control group.
- Citation: Jing FC, Zhang J, Feng C, Nian YY, Wang JH, Hu H, Yang BD, Sun XM, Zheng JY, Yin XR. Potential rat model of anxiety-like gastric hypersensitivity induced by sequential stress. World J Gastroenterol 2017; 23(42): 7594-7608
- URL: https://www.wjgnet.com/1007-9327/full/v23/i42/7594.htm
- DOI: https://dx.doi.org/10.3748/wjg.v23.i42.7594


