Copyright
©The Author(s) 2017.
World J Gastroenterol. Nov 7, 2017; 23(41): 7433-7439
Published online Nov 7, 2017. doi: 10.3748/wjg.v23.i41.7433
Published online Nov 7, 2017. doi: 10.3748/wjg.v23.i41.7433
Figure 1 Magnetic resonance images for caudate lesions.
A: T located between PV and IVC; B: Hepatic hemangioma located between RPV and IVC. IVC: Inferior vena cava; PV: Portal vein; RPV: Right portal vein; T: Tumor.
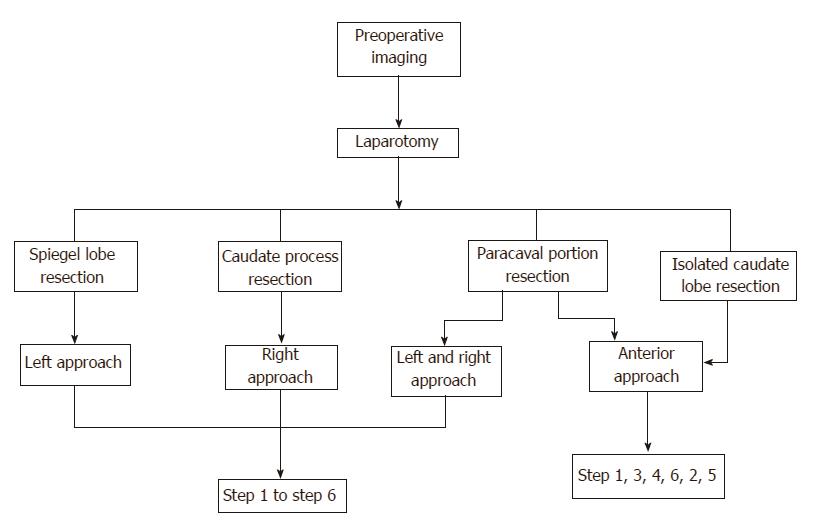
Figure 2 Surgical flow.
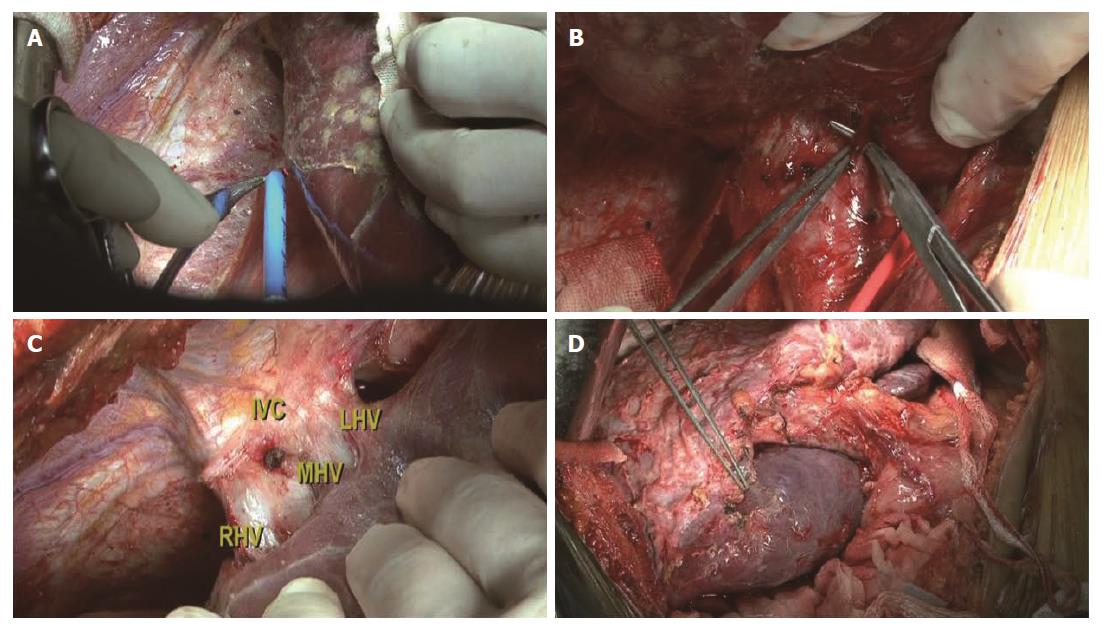
Figure 3 Flow of the caudate lobectomy.
A: Liver mobilization; B: Short hepatic veins isolated and divided; C: Three hepatic veins isolated; D: Ischemia landmark of the caudate lobe is shown.
Figure 4 Marking of the left boundary of the caudate lobe.
A: Divided Arantius ligament (black arrow); B: Left boundary of caudate lobe (white dotted line).
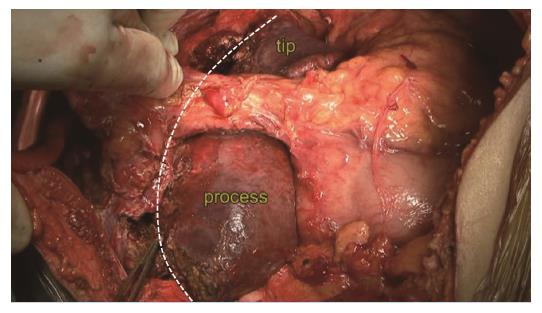
Figure 5 Identification of the right boundary of the caudate lobe.
Peng’s line was marked as the right boundary, which was from the upper tip to the process (white arc).
Figure 6 Splitting the liver by the anterior approach.
A: The hemangioma was exposed; B: The hemangioma was removed and the major vessels were identified.
- Citation: Jin Y, Wang L, Yu YQ, Zhou DE, Liu DR, Yang JJ, Peng SY, Li JT. Anatomic isolated caudate lobectomy: Is it possible to establish a standard surgical flow? World J Gastroenterol 2017; 23(41): 7433-7439
- URL: https://www.wjgnet.com/1007-9327/full/v23/i41/7433.htm
- DOI: https://dx.doi.org/10.3748/wjg.v23.i41.7433


