Copyright
©The Author(s) 2017.
World J Gastroenterol. Nov 7, 2017; 23(41): 7387-7396
Published online Nov 7, 2017. doi: 10.3748/wjg.v23.i41.7387
Published online Nov 7, 2017. doi: 10.3748/wjg.v23.i41.7387
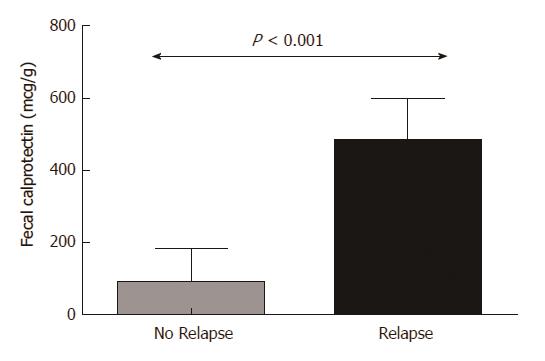
Figure 1 Increased baseline fecal calprotectin values in patients with inflammatory bowel disease are associated with elevated risk for clinical relapse within 6 mo.
Patients with disease relapse within 6 mo of follow up have higher FC values at baseline. Column bars represent median values with interquartile range. FC: Fecal calprotectin.
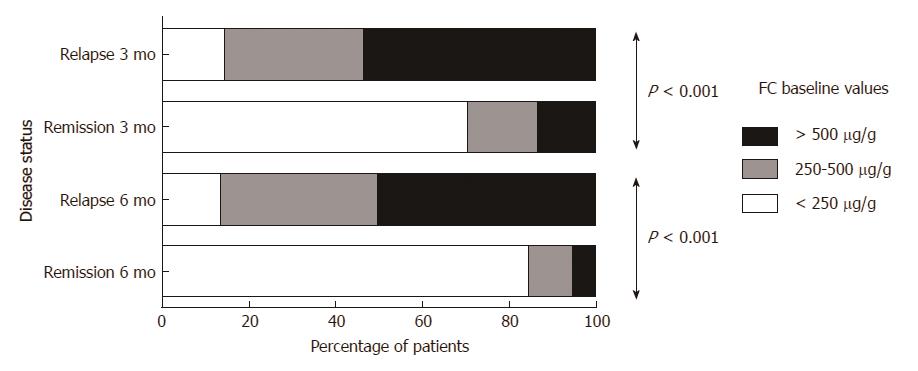
Figure 2 Dose-response effect of fecal calprotectin concentration on the probability for relapse both at 3- as well as at 6-mo post-measurement.
Cumulative number of patients with clinical relapse during 6-mo follow-up in relation to baseline concentration of fecal calprotectin. Patients belonging to the groups with higher FC values have an increased probability to relapse within both 3 and 6 mo of follow up. FC: Fecal calprotectin.
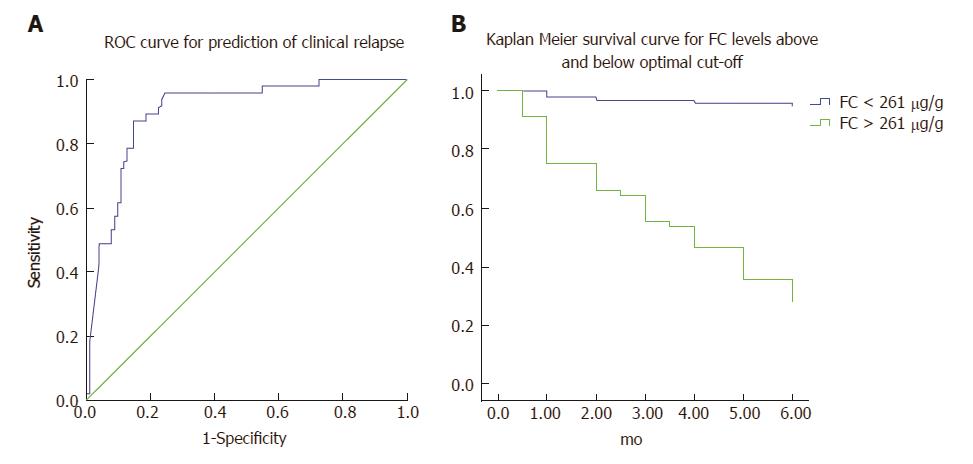
Figure 3 Optimal threshold fecal calprotectin values for predicting elevated risk of disease flare.
A: Receiver operating curve analysis: FC baseline levels accurately predict clinical relapse in IBD patients within 6 mo of follow up. B: Disease relapse survival curves (Kaplan-Meier analysis) of patients with FC levels below and above 261 μg/g at baseline. Patients with FC values above this threshold have a substantial risk of disease flare within 6 mo of follow up. FC: Fecal calprotectin; IBD: Inflammatory bowel disease.
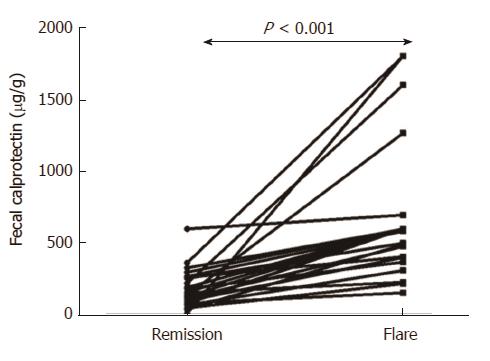
Figure 4 Fecal calprotectin values significantly increase during flare episodes in the same patient.
FC values are significantly increased during flare episodes in comparison to remission in the same patients. FC: Fecal calprotectin.
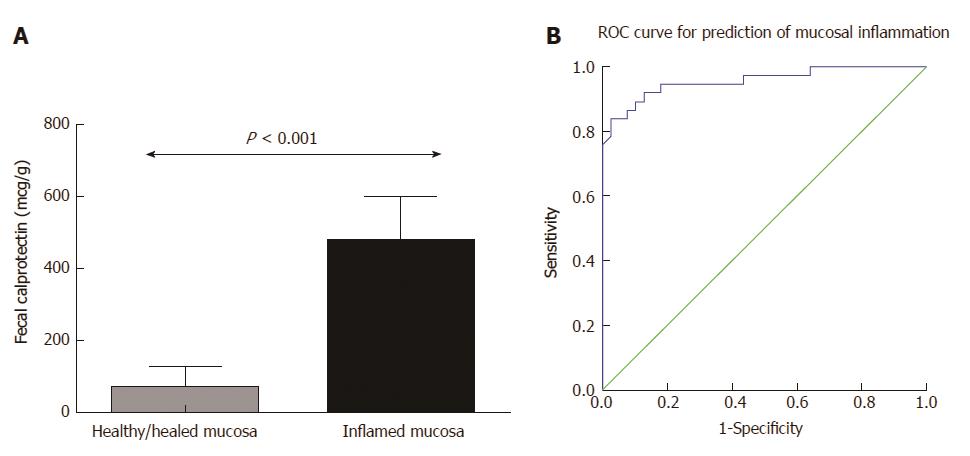
Figure 5 Lower fecal calprotectin baseline values are associated with increased probability of achieving mucosal healing.
A: Patients with mucosal healing at endoscopy performed within 6 mo of follow up have lower FC values at baseline. Column bars represent median values with interquartile range. B: Receiver operating curve analysis: FC baseline levels predict accurately the presence of mucosal inflammation in endoscopy performed within 6 mo of FC measurement. FC: Fecal calprotectin.
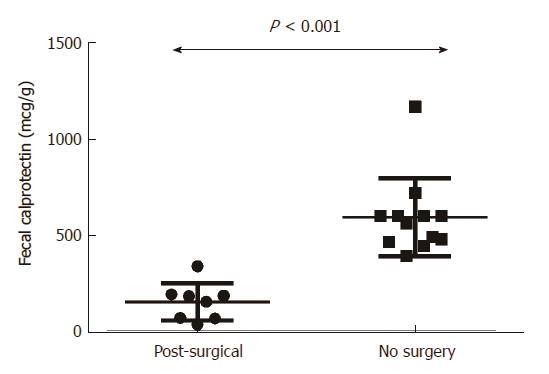
Figure 6 Endoscopic recurrence in post-surgical patients is associated with considerably lower fecal calprotectin values than in surgery-naïve CD patients with inflammation.
FC values are significantly lower in post-surgery CD-L1 patients with inflammation in comparison to surgery-naïve CD-L1 patients. Bars represent median values with interquartile range. FC: Fecal calprotectin; CD: Crohn’s disease.
- Citation: Kostas A, Siakavellas SI, Kosmidis C, Takou A, Nikou J, Maropoulos G, Vlachogiannakos J, Papatheodoridis GV, Papaconstantinou I, Bamias G. Fecal calprotectin measurement is a marker of short-term clinical outcome and presence of mucosal healing in patients with inflammatory bowel disease. World J Gastroenterol 2017; 23(41): 7387-7396
- URL: https://www.wjgnet.com/1007-9327/full/v23/i41/7387.htm
- DOI: https://dx.doi.org/10.3748/wjg.v23.i41.7387


