Copyright
©The Author(s) 2017.
World J Gastroenterol. Oct 28, 2017; 23(40): 7232-7241
Published online Oct 28, 2017. doi: 10.3748/wjg.v23.i40.7232
Published online Oct 28, 2017. doi: 10.3748/wjg.v23.i40.7232
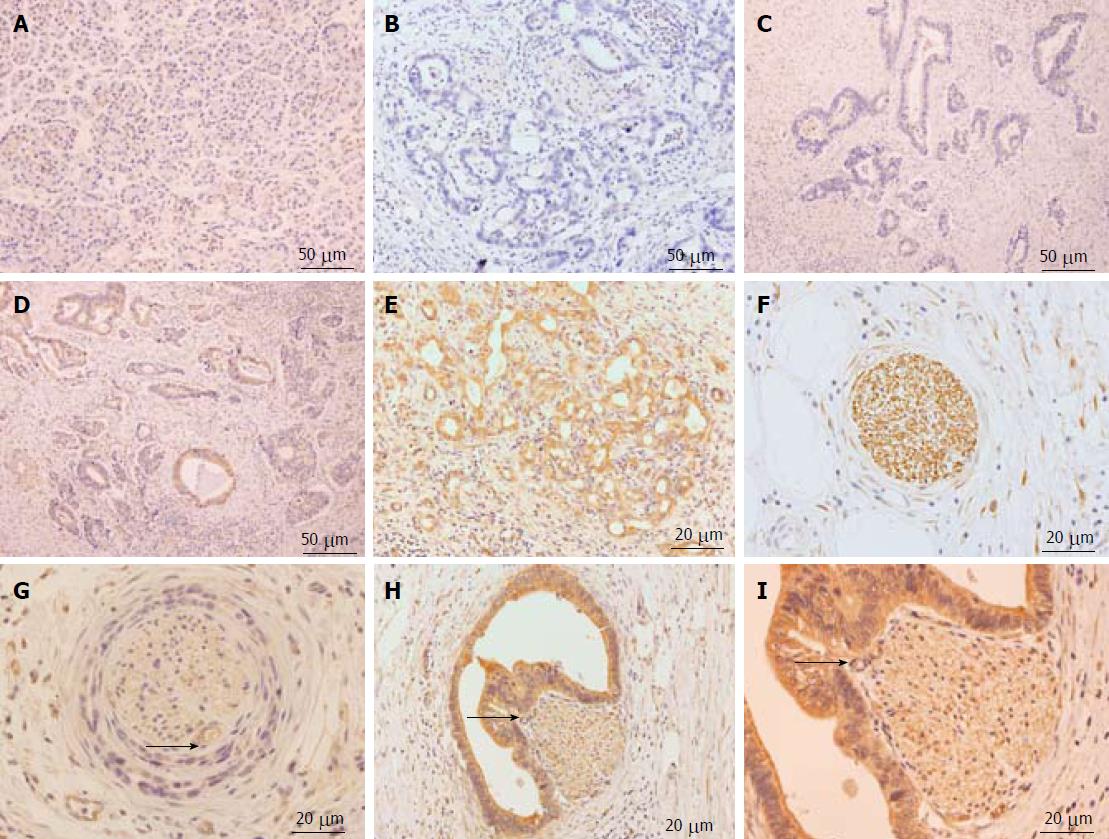
Figure 1 Representative immunohistochemical results of microtubule-associated protein 1A/1B-light chain 3 and perineural invasion.
A: Negative expression of LC3 in normal paraneoplastic pancreatic tissue (× 200); B: Negative expression of LC3 in pancreatic cancer tissue (× 200); C: Weakly positive expression of LC3 in pancreatic cancer tissue (× 200); D: Moderately positive expression of LC3 in pancreatic cancer tissue (× 200); E: Strongly positive expression of LC3 in pancreatic cancer tissue (× 200); F and G: Perineural invasion in pancreatic cancer tissues (× 400, arrow represents cancer cells infiltrating into nerve tissue); H: Pancreatic cancer cells with high LC3 expression enclosing and invading into nerve tissue (× 200, arrow represents cancer cells infiltrating into nerve tissue); I: Pancreatic cancer cells with high LC3 expression enclosing and invading into nerve tissue (× 400, arrow represents cancer cells infiltrating into nerve tissue). LC3: Microtubule-associated protein 1A/1B-light chain 3.
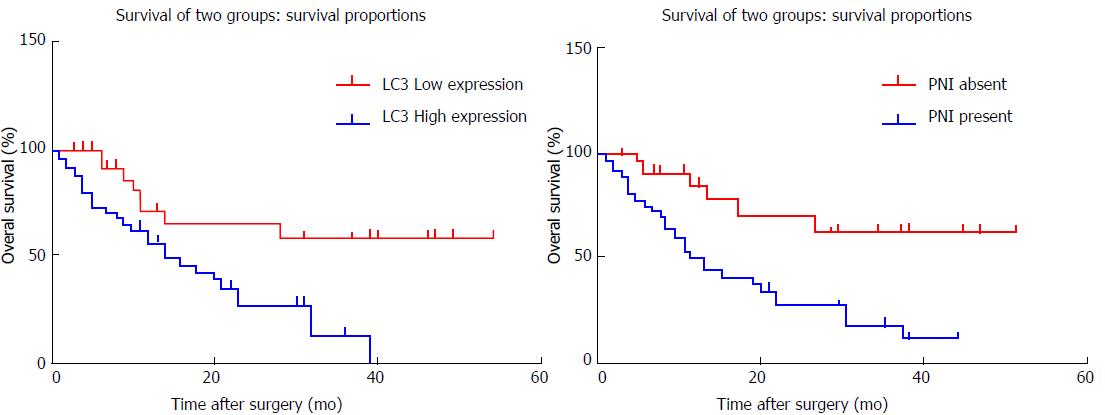
Figure 2 Kaplan-Meier estimates of overall survival in patients who underwent radical surgery.
A: The overall survival rate of the LC3 low-expression group was better than that of the high-expression group (P < 0.05); B: The overall survival rate of the patients without nerve invasion group was better than that of those with nerve infiltration (P < 0.05).
- Citation: Yang YH, Liu JB, Gui Y, Lei LL, Zhang SJ. Relationship between autophagy and perineural invasion, clinicopathological features, and prognosis in pancreatic cancer. World J Gastroenterol 2017; 23(40): 7232-7241
- URL: https://www.wjgnet.com/1007-9327/full/v23/i40/7232.htm
- DOI: https://dx.doi.org/10.3748/wjg.v23.i40.7232


