Copyright
©The Author(s) 2017.
World J Gastroenterol. Jan 28, 2017; 23(4): 687-696
Published online Jan 28, 2017. doi: 10.3748/wjg.v23.i4.687
Published online Jan 28, 2017. doi: 10.3748/wjg.v23.i4.687
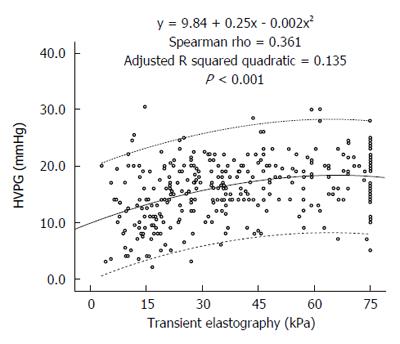
Figure 1 Scatterplot of transient elastography and hepatic venous pressure gradient values.
HVPG: Hepatic venous pressure gradient.
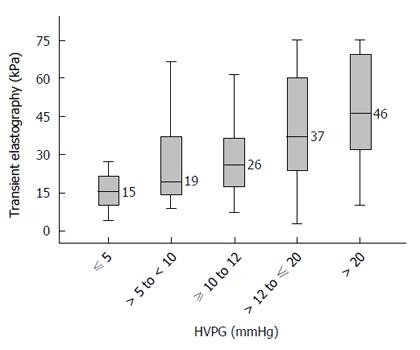
Figure 2 Median transient elastography values in patients with various stages of portal hypertension.
HVPG: Hepatic venous pressure gradient.
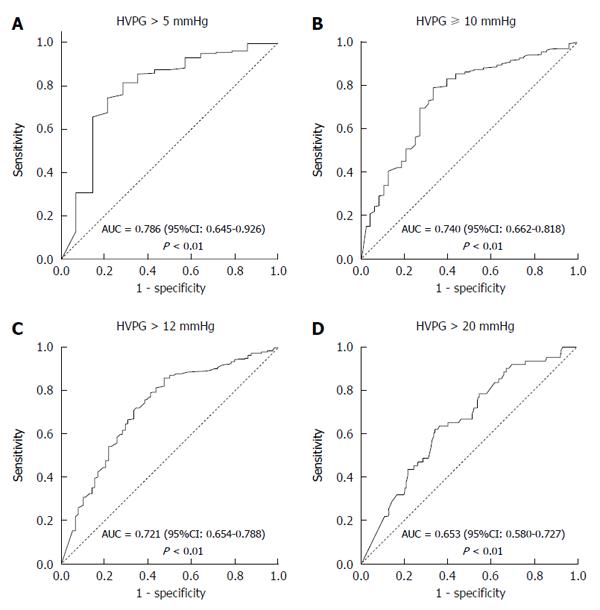
Figure 3 Receiver operating characteristic curves of transient elastography for predicting various stages of portal hypertension.
HVPG: Hepatic venous pressure gradient.
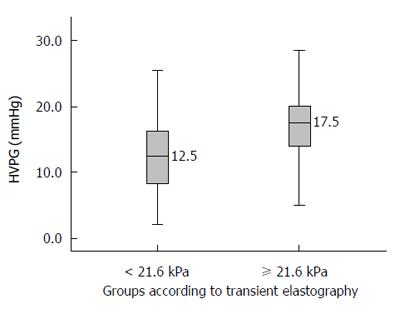
Figure 4 Median hepatic venous pressure gradient values in patients with transient elastography values less than and greater than 21.
6 kPa. HVPG: Hepatic venous pressure gradient.
- Citation: Kumar A, Khan NM, Anikhindi SA, Sharma P, Bansal N, Singla V, Arora A. Correlation of transient elastography with hepatic venous pressure gradient in patients with cirrhotic portal hypertension: A study of 326 patients from India. World J Gastroenterol 2017; 23(4): 687-696
- URL: https://www.wjgnet.com/1007-9327/full/v23/i4/687.htm
- DOI: https://dx.doi.org/10.3748/wjg.v23.i4.687


