Copyright
©The Author(s) 2017.
World J Gastroenterol. Jan 28, 2017; 23(4): 653-660
Published online Jan 28, 2017. doi: 10.3748/wjg.v23.i4.653
Published online Jan 28, 2017. doi: 10.3748/wjg.v23.i4.653
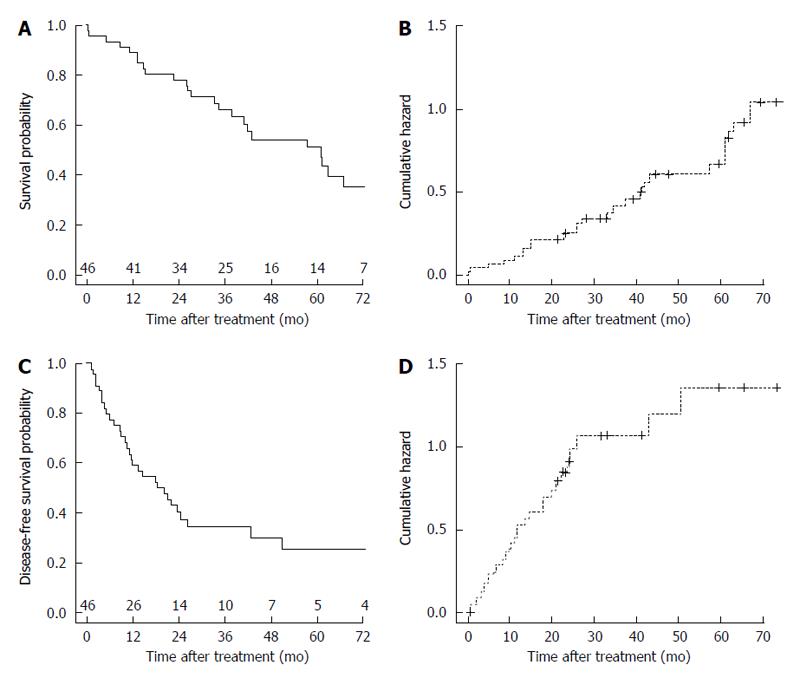
Figure 1 Overall and disease-free survival curves of the laparoscopically-treated hepatocellular carcinoma patients and their corresponding cumulative hazard curves.
A: Overall survival curve of the laparoscopically-treated hepatocellular carcinoma (HCC) patients. Number of patients at risk at each time point is shown at top of the x-axis; B: Cumulative hazard for the corresponding overall survival curve; C: Disease-free survival curve of the laparoscopically-treated HCC patients. Number of patients at risk at each time point is shown at top of the X-axis; D: Cumulative hazard for the corresponding disease-free survival curve.
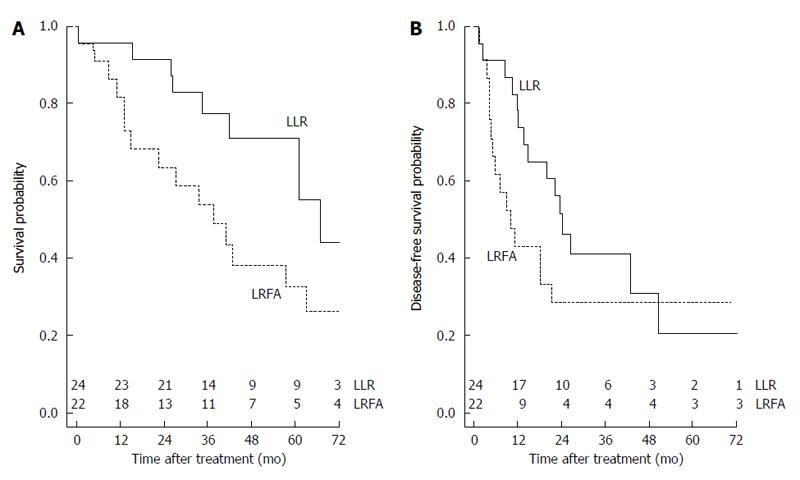
Figure 2 Comparison of the overall and disease-free survival probability for hepatocellular carcinoma patients by stratifying for laparoscopic treatment.
A: Comparison of the overall survival probability for hepatocellular carcinoma (HCC) patients by stratifying for laparoscopic treatment (LLR: 0.442; LRFA: 0.261; P = 0.048). Number of patients at risk at each time point is shown at top of the x-axis; B: Comparison of the disease-free survival probability for HCC patients by stratifying for laparoscopic treatment (LLR: 0.206; LRFA: 0.286; P = 0.205). Number of patients at risk at each time point is shown at top of the X-axis. LLR: Laparoscopic liver resection; LRFA: Laparoscopic radiofrequency ablation.
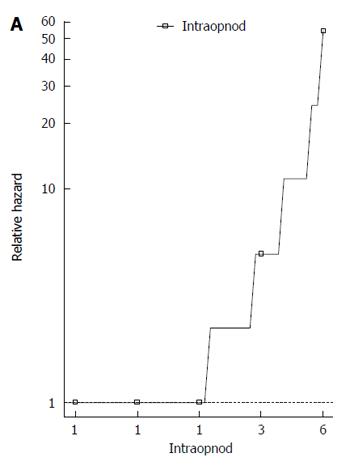
Figure 3 Rank-hazard plot for the number of intraoperative hepatocellular carcinoma nodules.
Based on the univariate Cox model for overall survival.
- Citation: Casaccia M, Santori G, Bottino G, Diviacco P, Andorno E. Laparoscopic resection vs laparoscopic radiofrequency ablation for the treatment of small hepatocellular carcinomas: A single-center analysis. World J Gastroenterol 2017; 23(4): 653-660
- URL: https://www.wjgnet.com/1007-9327/full/v23/i4/653.htm
- DOI: https://dx.doi.org/10.3748/wjg.v23.i4.653


