Copyright
©The Author(s) 2017.
World J Gastroenterol. Sep 7, 2017; 23(33): 6194-6196
Published online Sep 7, 2017. doi: 10.3748/wjg.v23.i33.6194
Published online Sep 7, 2017. doi: 10.3748/wjg.v23.i33.6194
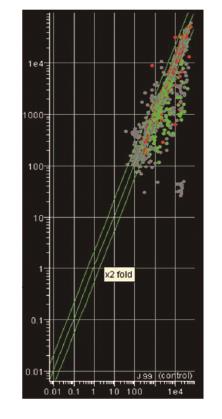
Figure 1 Representative scatter analysis of the general patterns of H.
pylori genomic response to human β-defensin 3 (hβD3) revealed by transcriptional profiling. Scatter plots (log2 ratio) of average normalized intensities representing Cy5-red channel versus Cy3-green channel are shown for experiments in the presence of sublethal concentrations of hβD3 compared with “control” conditions (no hβD3). Differential expression of a given gene is reflected by deviation from the central diagonal line. The upper diagonal defines ≥ 2-fold up-regulation and the lower one defines ≥ 2-fold down-regulation.
- Citation: Kazakos EI, Dorrell N, Polyzos SA, Deretzi G, Kountouras J. Comment on “Effect of biofilm formation by clinical isolates of Helicobacter pylori on the efflux-mediated resistance to commonly used antibiotics”. World J Gastroenterol 2017; 23(33): 6194-6196
- URL: https://www.wjgnet.com/1007-9327/full/v23/i33/6194.htm
- DOI: https://dx.doi.org/10.3748/wjg.v23.i33.6194


