Copyright
©The Author(s) 2017.
World J Gastroenterol. Sep 7, 2017; 23(33): 6119-6127
Published online Sep 7, 2017. doi: 10.3748/wjg.v23.i33.6119
Published online Sep 7, 2017. doi: 10.3748/wjg.v23.i33.6119
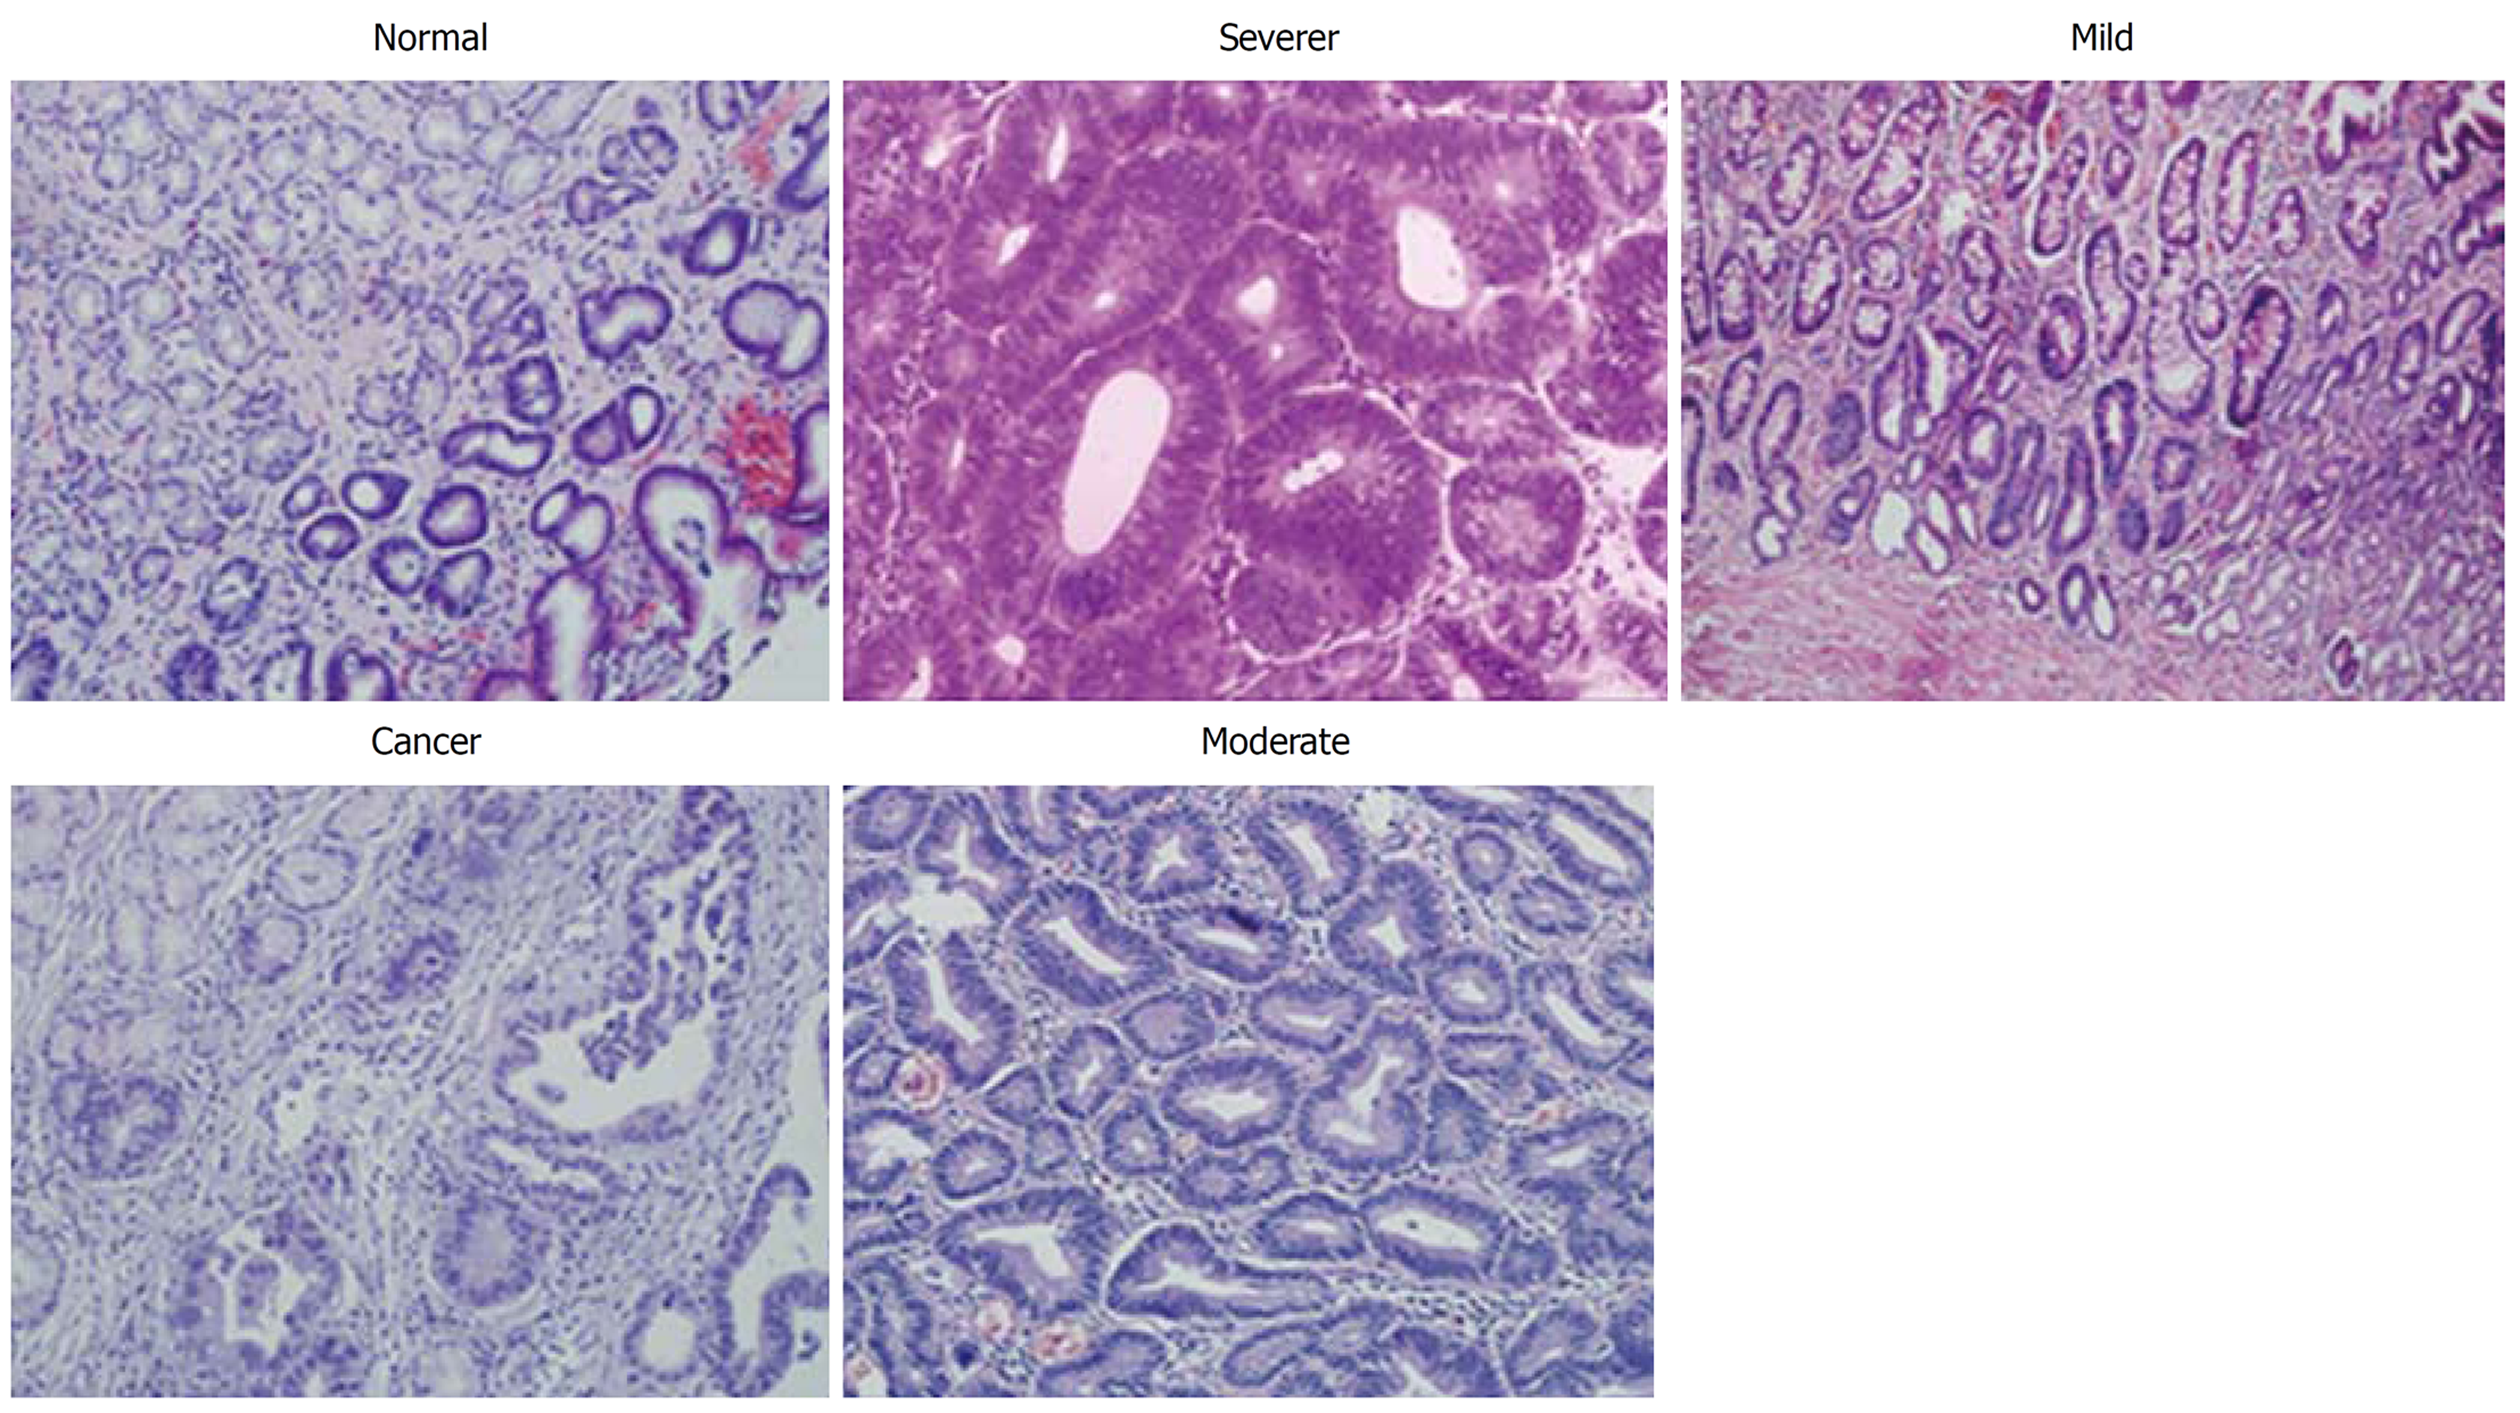
Figure 1 Representative graphs of HE staining (20 ×) of various gastric tissues including dysplasia.
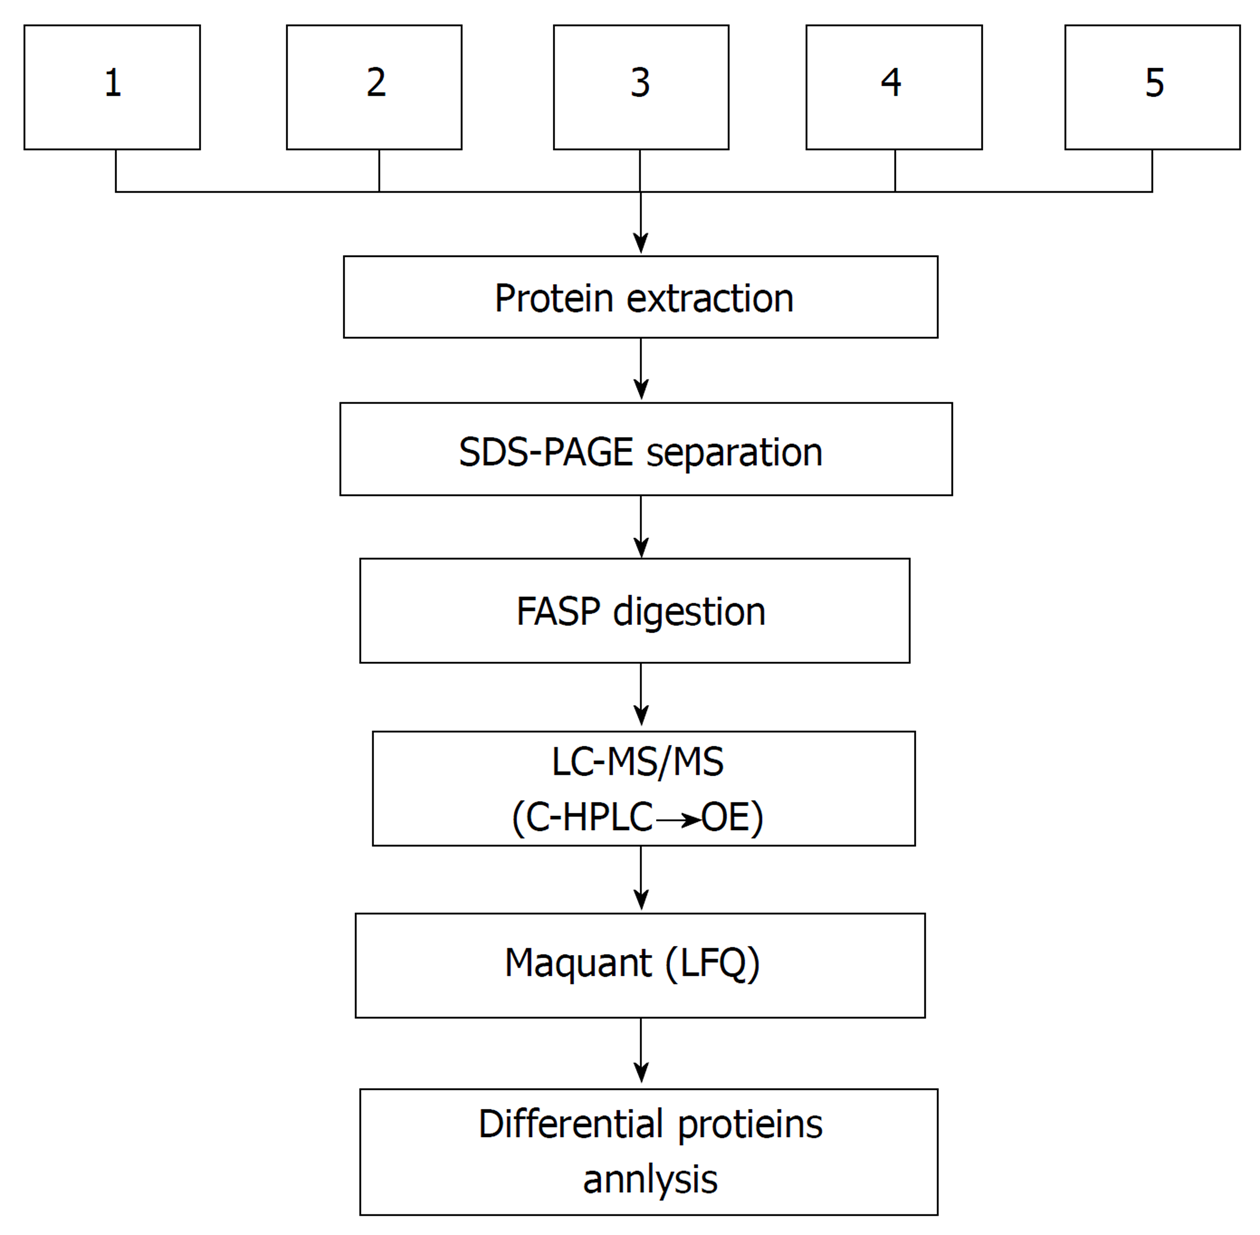
Figure 2 Outline of proteomic experimental workflow.
SDS-PAGE: Sodium dodecyl sulfate polyacrylamide gel electrophoresis; C-HPLC: Capillary-high performance liquid chromatography; QE: Q-exactive; LFQ: Label free quantitative.
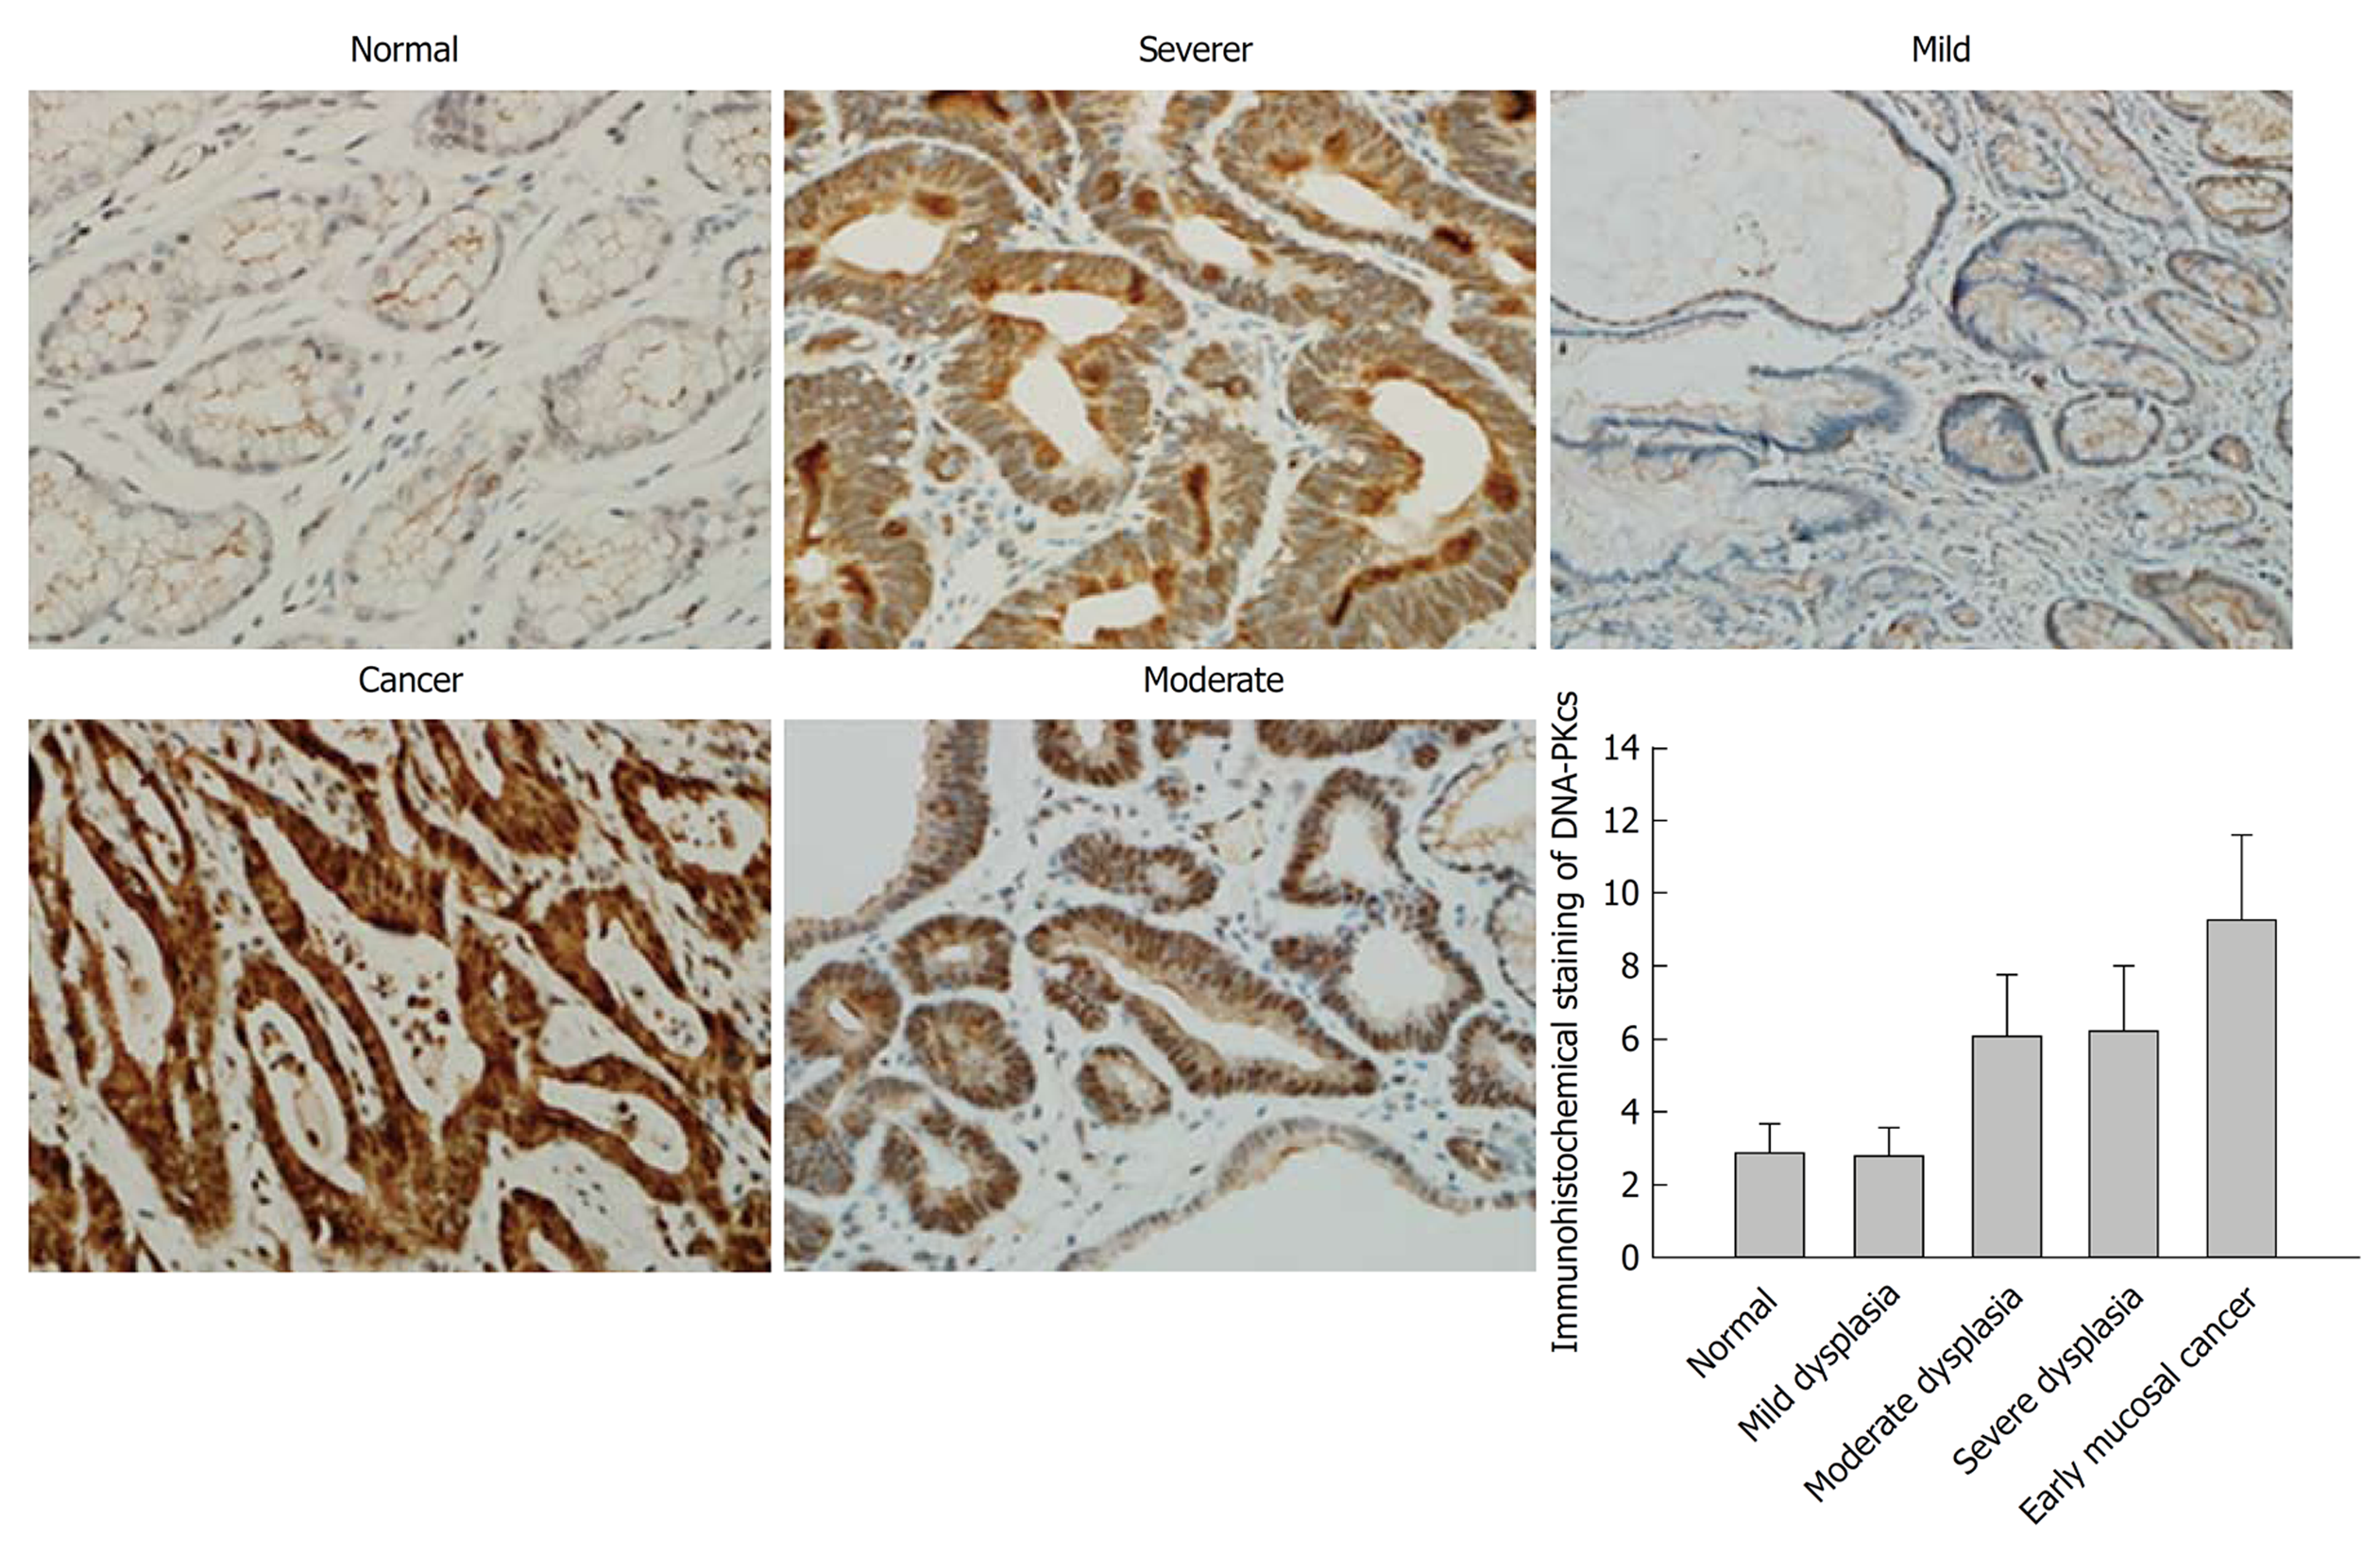
Figure 3 Immunohistochemical staining of DNA-PKcs (40 ×).
A: Normal; B: Mild dysplasia; C: Moderate dysplasia; D: Severe dysplasia; E: Early mucosal cancer.
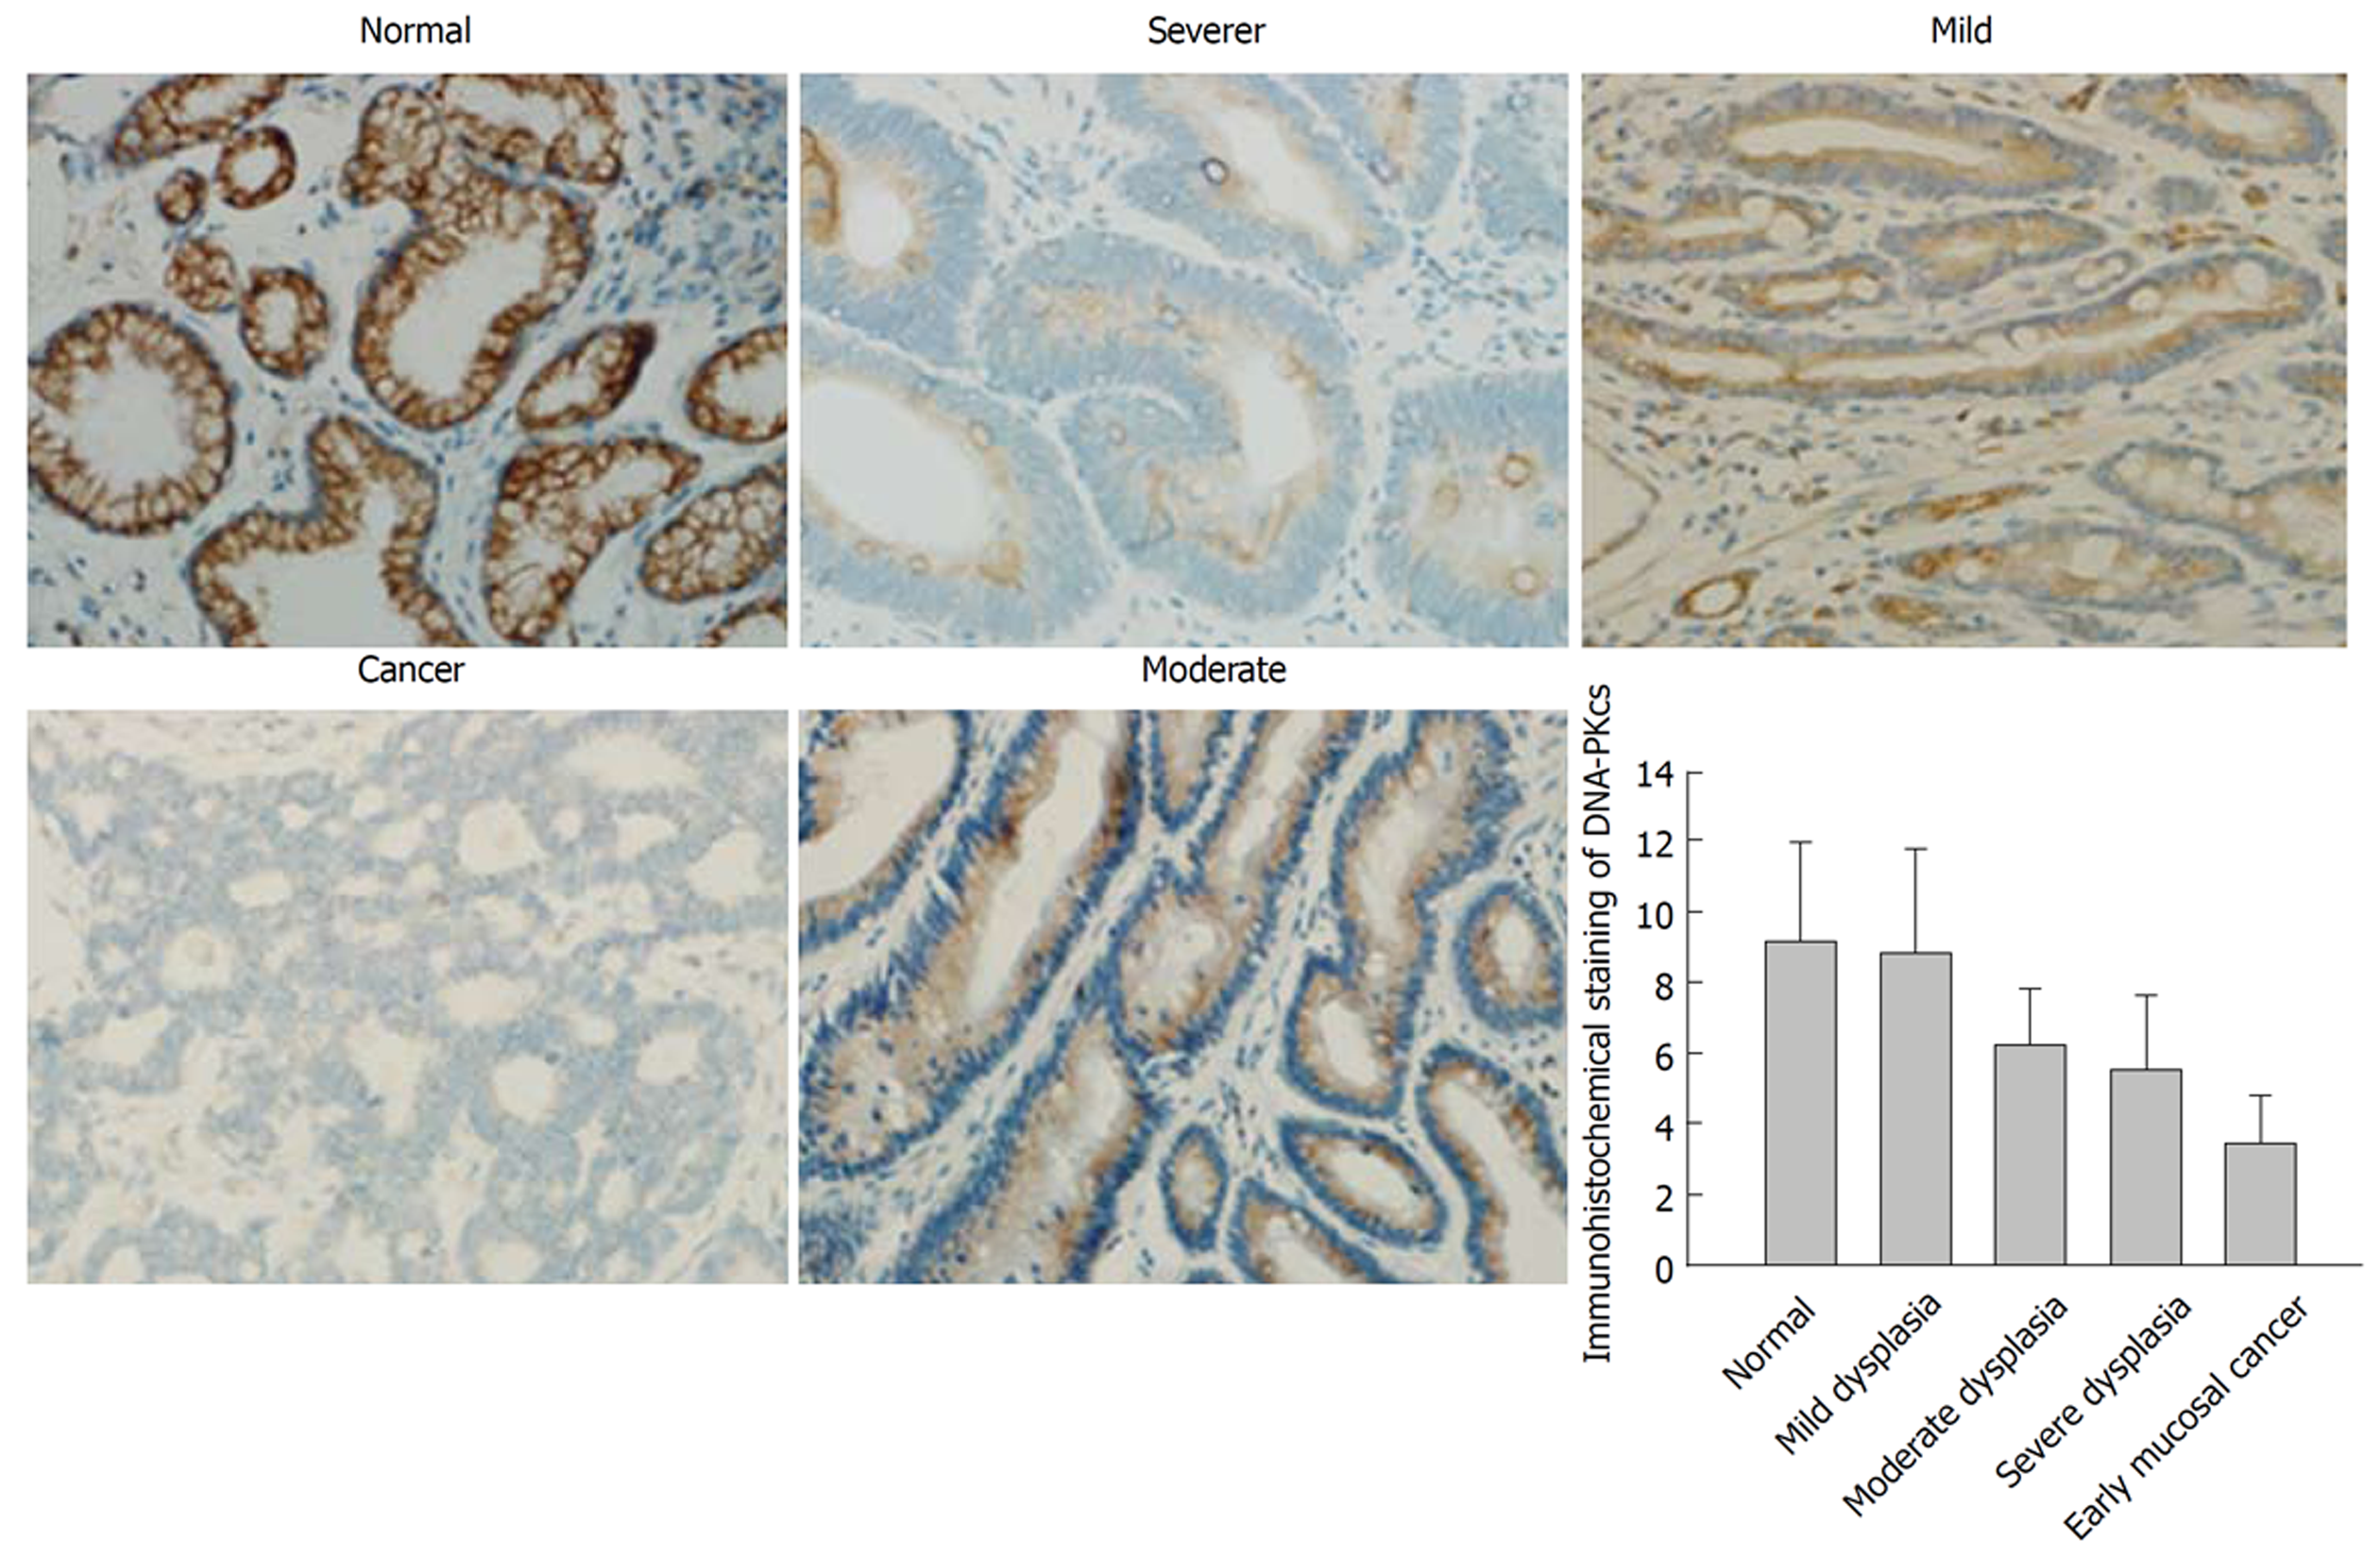
Figure 4 Immunohistochemical staining of ERGIC1 (40 ×).
A: Normal; B: Mild dysplasia; C: Moderate dysplasia; D: Severe dysplasia; E: Early mucosal cancer.
- Citation: Wang FR, Wei YC, Han ZJ, He WT, Guan XY, Chen H, Li YM. Aberrant DNA-PKcs and ERGIC1 expression may be involved in initiation of gastric cancer. World J Gastroenterol 2017; 23(33): 6119-6127
- URL: https://www.wjgnet.com/1007-9327/full/v23/i33/6119.htm
- DOI: https://dx.doi.org/10.3748/wjg.v23.i33.6119


