Copyright
©The Author(s) 2017.
World J Gastroenterol. Aug 28, 2017; 23(32): 5945-5953
Published online Aug 28, 2017. doi: 10.3748/wjg.v23.i32.5945
Published online Aug 28, 2017. doi: 10.3748/wjg.v23.i32.5945
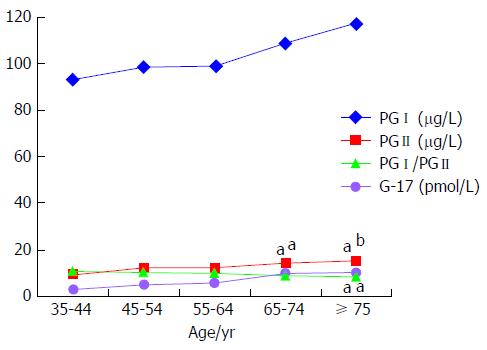
Figure 1 Comparison of serum gastric biomarker levels in various age groups.
There was no significant difference in serum levels of PGI and G-17 between each age group with increasing age. In contrast, serum levels of PGII increased with age, and were significantly higher in subjects ≥ 65-years-old compared to 35-44-years-old group. The ratio of PGI/PGII decreased with age, and was significantly lower in subjects ≥ 75-years-old compared to 35-44-years-old group. The “a” denotes comparison with 35-44-years-old age group, aP < 0.05, bP < 0.01. G-17: Gastrin-17; PGI: Pepsinogen I; PGII: Pepsinogen II.
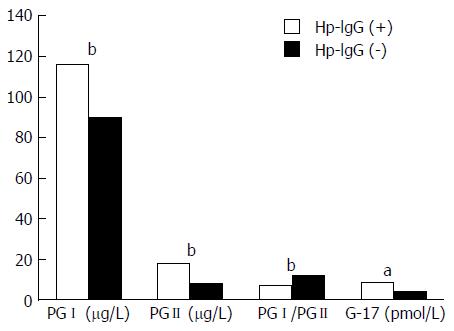
Figure 2 Comparison of serum gastric biomarker levels by Helicobacter pylori infection status.
Compared to non-infected subjects, serum levels of PGI, PGII and G-17 were significantly higher, while the ratio of PGI/PGII was significantly lower in Helicobacter pylori-infected subjects. aP < 0.05, bP < 0.01. G-17: Gastrin-17; PGI: Pepsinogen I; PGII: Pepsinogen II.
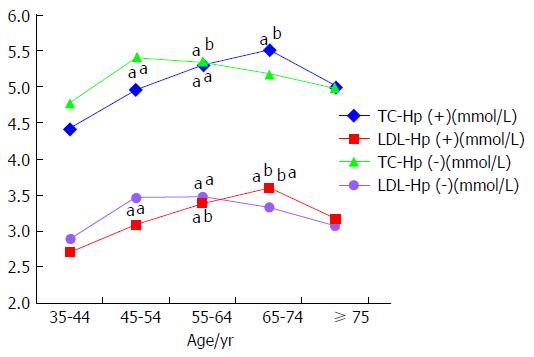
Figure 3 Comparison of serum cholesterol levels in various age groups by Helicobacter pylori infection status.
In H. pylori-infected subjects, serum levels of TC and LDL were significantly higher in subjects between 55- and 74-years-old compared to those in the 35-44-years-old age group. In non-infected subjects, serum levels of TC and LDL were significantly higher in subjects between 45- and 64-years-old compared to those in the 35-44-years-old age group. The “a” denotes comparison with the 35-44-years-old age group and the “b” denotes comparison with the 45-54-years-old age group, aP < 0.05, bP < 0.01. H. pylori: Helicobacter pylori; LDL-C: Low-density lipoprotein cholesterol; TC: Total cholesterol.
- Citation: Shan JH, Bai XJ, Han LL, Yuan Y, Sun XF. Changes with aging in gastric biomarkers levels and in biochemical factors associated with Helicobacter pylori infection in asymptomatic Chinese population. World J Gastroenterol 2017; 23(32): 5945-5953
- URL: https://www.wjgnet.com/1007-9327/full/v23/i32/5945.htm
- DOI: https://dx.doi.org/10.3748/wjg.v23.i32.5945


