Copyright
©The Author(s) 2017.
World J Gastroenterol. Aug 28, 2017; 23(32): 5913-5924
Published online Aug 28, 2017. doi: 10.3748/wjg.v23.i32.5913
Published online Aug 28, 2017. doi: 10.3748/wjg.v23.i32.5913
Figure 1 Agarose gel with PCR products for the thymidylate synthase 5’untranslated region 28 bp insertion.
A DNA ladder of repeated 50 bp fragments was used (M 50 bp). All potential genotypes (2R 241 bp and 3R 242 bp) are depicted as well, as a sample with LOH for 3R (Lane 3). bp: Base pair; LOH: Loss of heterozygosity; UTR: Untranslated region.
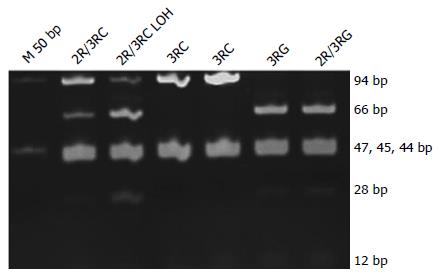
Figure 2 Polyacrylamide gel resolution showing the 12G>C substitution in the 5’untranslated region after digestion.
Expected bands are 12, 44, 45 and 47 bp for all genotypes. Digestion of a sample with 2R or 3R12G genotype results in production of two bands of 66 and 28 bp, while in 3R12C genotypes those two fragments are left undigested in a single 94 bp fragment. bp: Base pair; LOH: Loss of heterozygosity; UTR: Untranslated region.
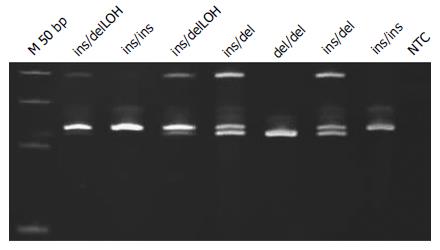
Figure 3 Polyacrylamide gel resolution showing the 3’untranslated region products.
Expected bands are 104 and 110 bp. In heterozygotes, a second band of approximately 200 bp was observed due to heteroduplex mismatches. bp: Base pair; UTR: Untranslated region.
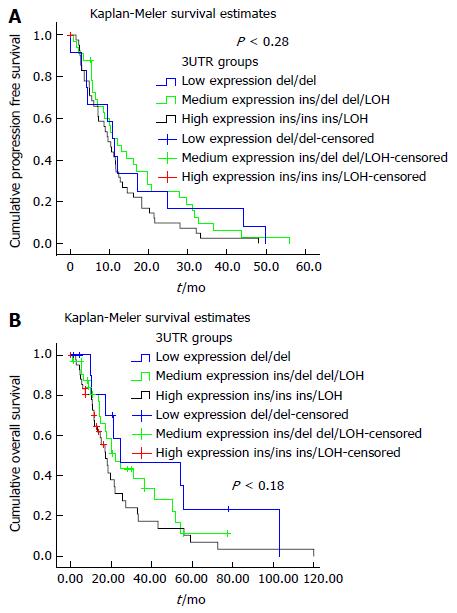
Figure 4 Kaplan-Meier survival curve.
A: Kaplan-Meier curve for PFS according to TYMS 3’UTR groups; B: Kaplan-Meier curve for OS according to TYMS 3’UTR groups. Comparisons were made using long-rank tests. OS: Overall survival; PFS: Progression-free survival; UTR: Untranslated region.
- Citation: Ntavatzikos A, Spathis A, Patapis P, Machairas N, Peros G, Konstantoudakis S, Leventakou D, Panayiotides IG, Karakitsos P, Koumarianou A. Integrating TYMS, KRAS and BRAF testing in patients with metastatic colorectal cancer. World J Gastroenterol 2017; 23(32): 5913-5924
- URL: https://www.wjgnet.com/1007-9327/full/v23/i32/5913.htm
- DOI: https://dx.doi.org/10.3748/wjg.v23.i32.5913


