Copyright
©The Author(s) 2017.
World J Gastroenterol. Aug 14, 2017; 23(30): 5499-5507
Published online Aug 14, 2017. doi: 10.3748/wjg.v23.i30.5499
Published online Aug 14, 2017. doi: 10.3748/wjg.v23.i30.5499
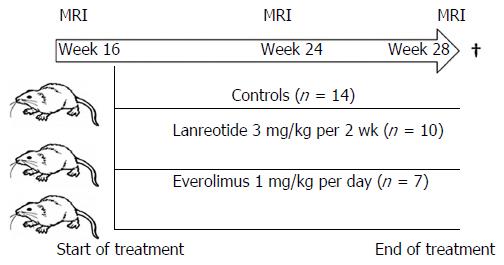
Figure 1 Study design.
Female PCK rats were obtained at age week 10. At week 16, a first MRI was performed to calculate the liver volume. Animals were randomly assigned to one of the groups and treatment was started. At week 24 and week 28 a new MRI was performed, after the last measurement the animals were sacrificed and tissue collected for protein and gene assay.
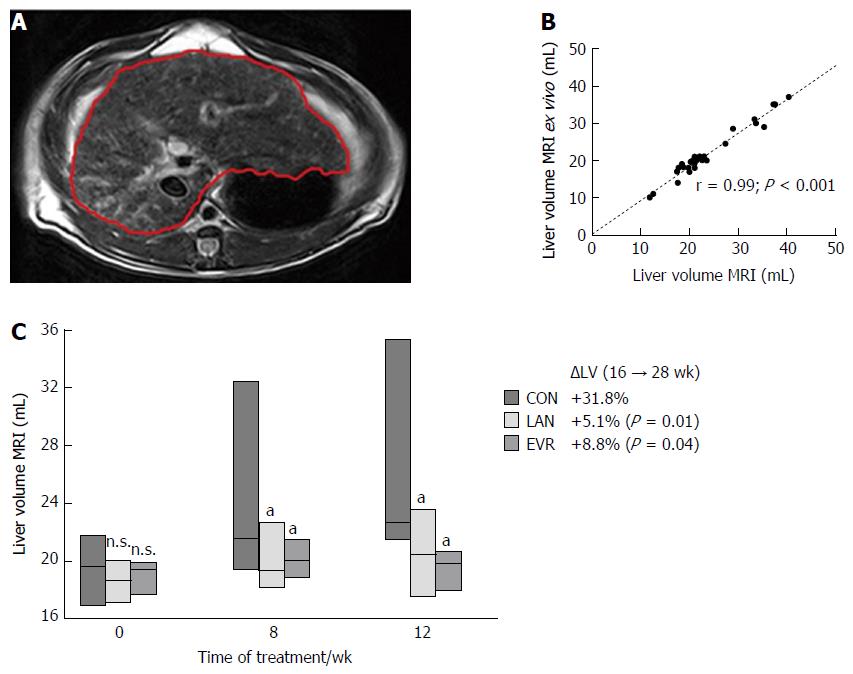
Figure 2 Liver volume measurements.
A: Demonstration of liver volume measured by MRI on each liver-containing slice of T2 weighted images. The liver margin is contoured manually with the red line; B: Correlation between liver volume calculated from MRI scan and liver volume measured ex vivo. Pearson correlation (r) is given together with significance; C: Liver volume (mean ± SE) determined by MRI for the different groups: CON (controls, n = 14), LAN (n = 10) and EVR (n = 7), measured at start of treatment, and after 8 and 12 wk. aP < 0.05 vs animals in control group at corresponding time, NS: Not significant, vs control. The percentual change in LV (ΔLV) over the 12 wk experimental period is shown together with the P value vs control group. LAN: Lanreotide; EVR: Everolimus.
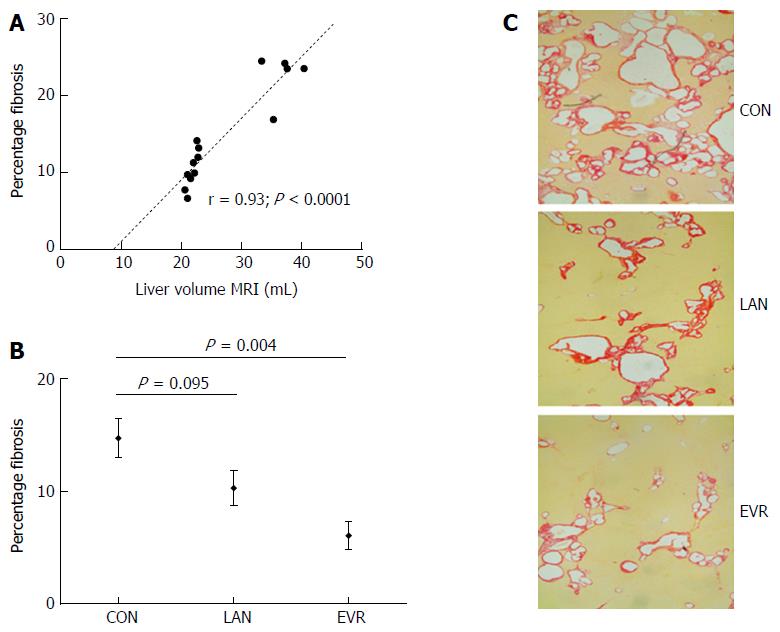
Figure 3 Liver fibrosis in PCK rats and effect of treatment with lanreotide or everolimus.
Picrosirius red collagen staining was performed on formalin fixed, paraffin embedded liver tissue, staining was assessed using Olympus Stream image analysis software 1.9 Software. Fibrosis was expressed as percentage of total liver parenchyma from 4 random selected samples per animal. A: Pearson correlation (r) and significance for liver volume with fibrosis in control animals; B: Amount of fibrosis relative to total parenchyma in the livers of PCK rats after 12 wk of treatment with LAN or EVR and in controls. Results are given as mean and SE; C: Representative images of the amount of fibrosis by picrosirius red staining in the 3 groups (original magnification × 40). CON: Control; LAN: Lanreotide; EVR: Everolimus.
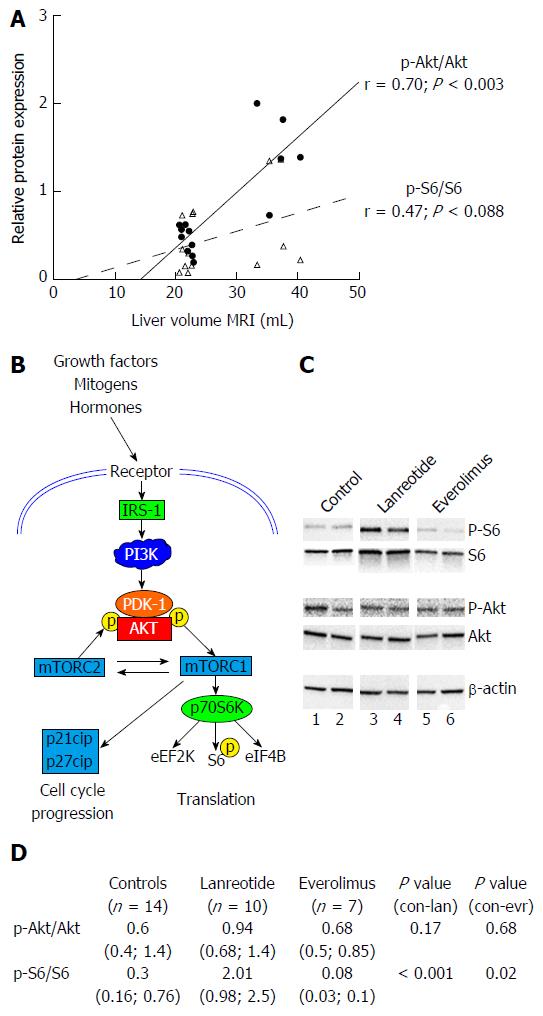
Figure 4 Analysis of protein expression of components of PI3K/AKT/mTOR pathway by Western blot in livers of PCK rats after 12 wk of treatment.
A: phosphorylation ratio in untreated animals: correlation between p-Akt/Akt ratio and p-S6/S6 ratio with liver volume. Pearson correlation (r) is given together with significance; B: Simplified schematic presentation of PI3K/AKT/mTOR signaling pathway; C: shows two representative samples from each experimental group; D: shows relative expression mean (range) of phosphorylated Akt vs total Akt (p-Akt/Akt) and S6 vs total S6 (p-S6/S6) with n as number of animals analyzed. Expression of proteins was normalized to β-actin levels.
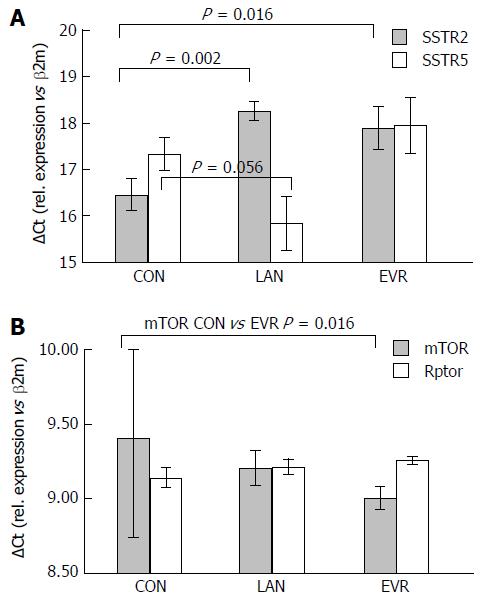
Figure 5 Liver gene expression of target genes for LAN treatment (SSTR2, SSTR5) and for PI3K/Akt/mTOR pathway (mTOR, Rptor).
A: expression of the Somatostatin receptors SSTR2 and SSTR5; B: expression of mTOR and of Rptor. The mean for delta Ct value (with SE) is given vs that for the reference (housekeeping gene) β2M. To be noted, a higher value means a lower expression. CON: Control; LAN: Lanreotide; EVR: Everolimus.
- Citation: Temmerman F, Chen F, Libbrecht L, Vander Elst I, Windmolders P, Feng Y, Ni Y, De Smedt H, Nevens F, van Pelt J. Everolimus halts hepatic cystogenesis in a rodent model of polycystic-liver-disease. World J Gastroenterol 2017; 23(30): 5499-5507
- URL: https://www.wjgnet.com/1007-9327/full/v23/i30/5499.htm
- DOI: https://dx.doi.org/10.3748/wjg.v23.i30.5499


