Copyright
©The Author(s) 2017.
World J Gastroenterol. Jul 14, 2017; 23(26): 4767-4778
Published online Jul 14, 2017. doi: 10.3748/wjg.v23.i26.4767
Published online Jul 14, 2017. doi: 10.3748/wjg.v23.i26.4767
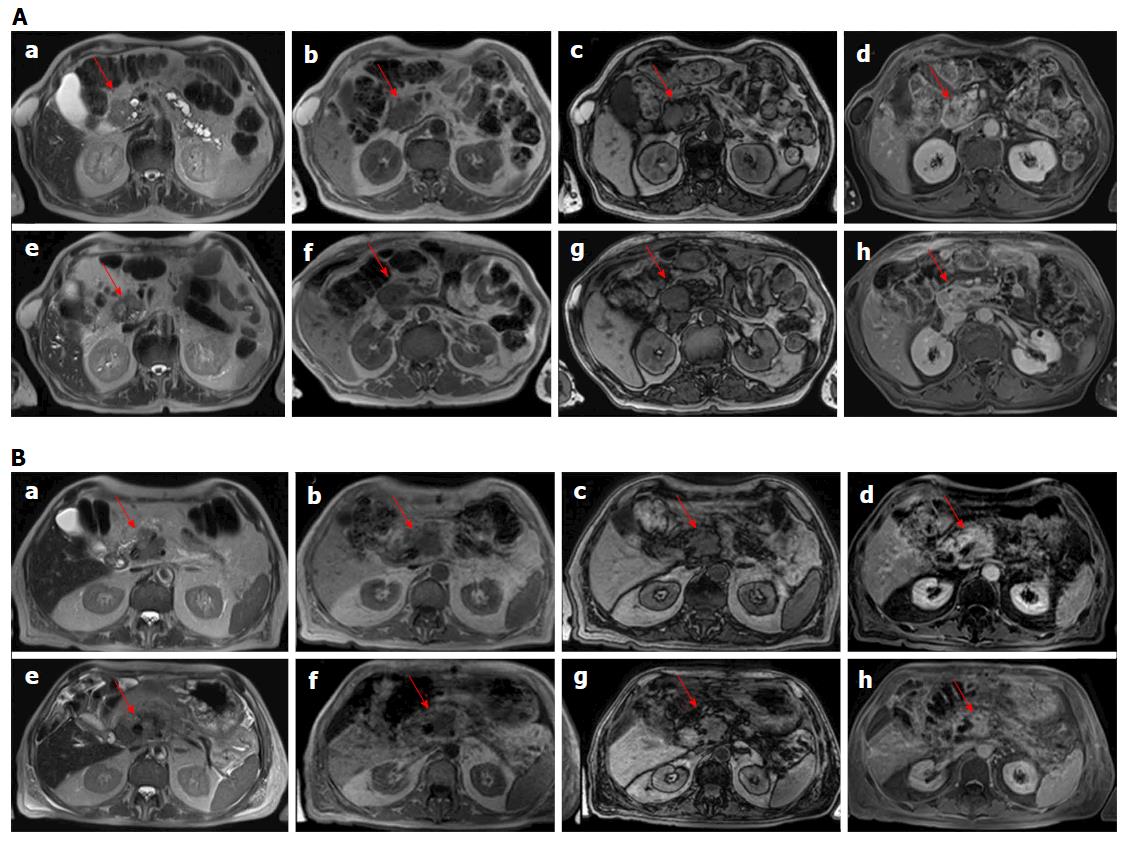
Figure 1 Magnetic resonance imaging assessment using morphological criteria for two patients (in A man 79 years old and in B man 74 years old).
Before treatment in HASTE T2-W sequence (a), the lesion (arrow) appears hyperintense, in in-phase T1-W sequence (b) and out-phase T1-W sequence (c) appears hypointense and hypovascular in VIBE T1-W in equilibrium phase (d). After the treatment the lesion in HASTE T2-W sequence (e), in-phase T1-W sequence (f), out-phase T1-W sequence (g) and VIBE T1-W in equilibrium phase (h): there were not significant differences in signal compared to the similar before the treatment. HASTE: Half-Fourier Acquisition Single-Shot Turbo Spin-Echo; VIBE: Volumetric Interpolated Breath-hold Examination.
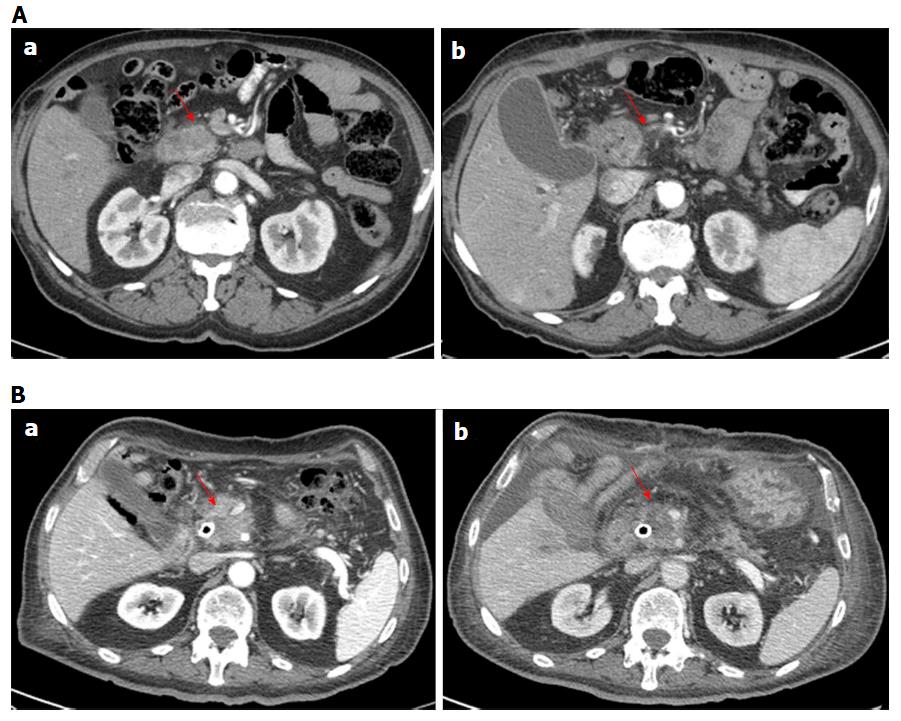
Figure 2 Computed tomography imaging assessment using morphological criteria for two patients (in A man 79 years old and in B man 74 years old).
In pancreatic phase on CT study (a) the lesion appears hypodense (arrow). After the treatment in pancreatic phase on CT study (b) the lesion appears similar than in (a) but there was a significant variation in CT density value. CT: Computed tomography.
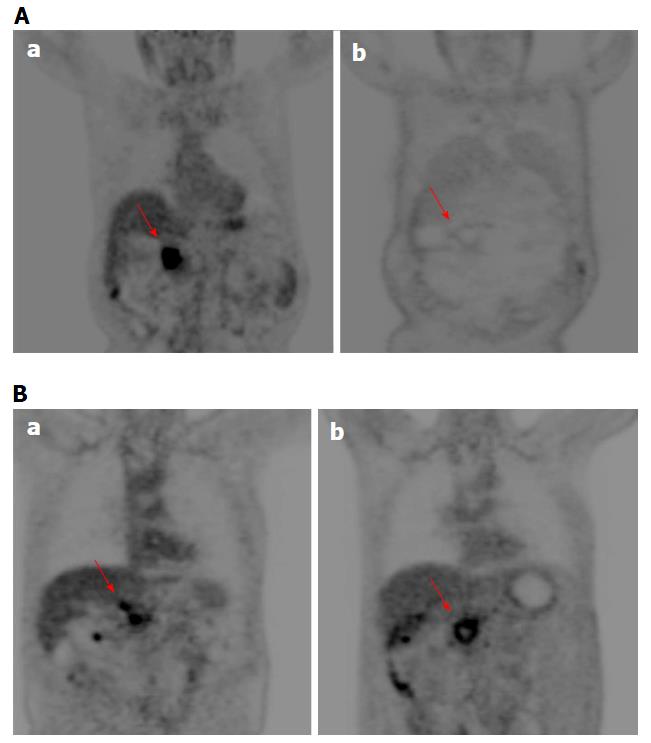
Figure 3 Positron emission tomography imaging assessment using morphological criteria for two patients (in A man 79 years old and in B man 74 years old).
PET study before treatment (a) and after the treatment (b). In (b) the lesion (arrow) exhibited a reduction of glucose uptake. PET: Positron emission tomography.
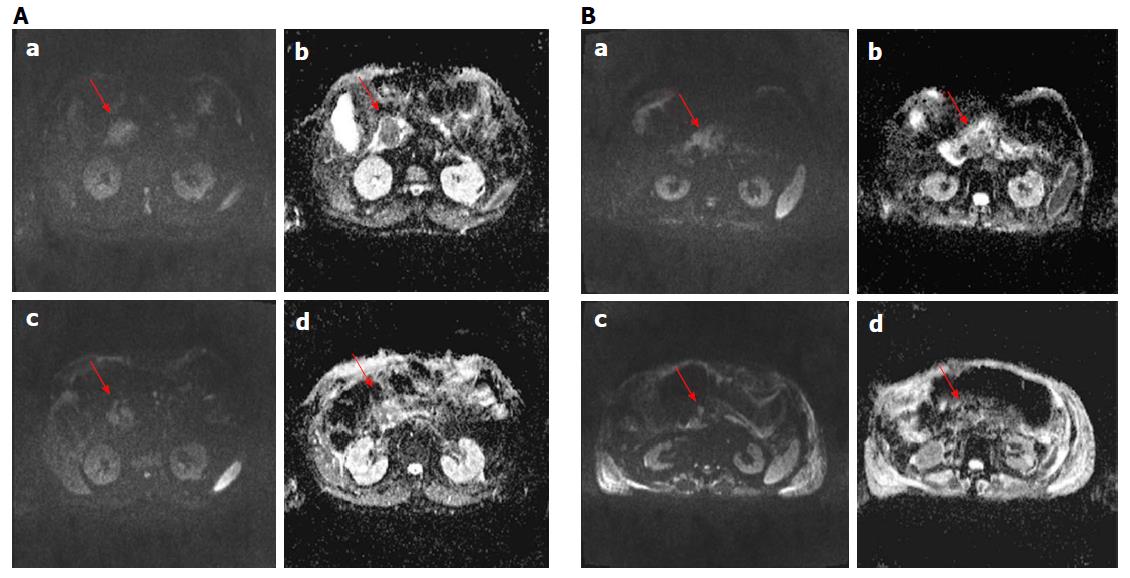
Figure 4 Diffusion weighted imaging assessment using morphological criteria for two patients (in A man 79 years old and in B man 74 years old).
In a (image at b value 800), in b (ADC map) is showed the lesion before the treatment and in c (image at b value 800) and d (ADC map) is showed the lesion after the treatment; there was a difference in diffusion maps before and after treatment.
- Citation: Granata V, Fusco R, Setola SV, Piccirillo M, Leongito M, Palaia R, Granata F, Lastoria S, Izzo F, Petrillo A. Early radiological assessment of locally advanced pancreatic cancer treated with electrochemotherapy. World J Gastroenterol 2017; 23(26): 4767-4778
- URL: https://www.wjgnet.com/1007-9327/full/v23/i26/4767.htm
- DOI: https://dx.doi.org/10.3748/wjg.v23.i26.4767


