Copyright
©The Author(s) 2017.
World J Gastroenterol. Jul 14, 2017; 23(26): 4759-4766
Published online Jul 14, 2017. doi: 10.3748/wjg.v23.i26.4759
Published online Jul 14, 2017. doi: 10.3748/wjg.v23.i26.4759
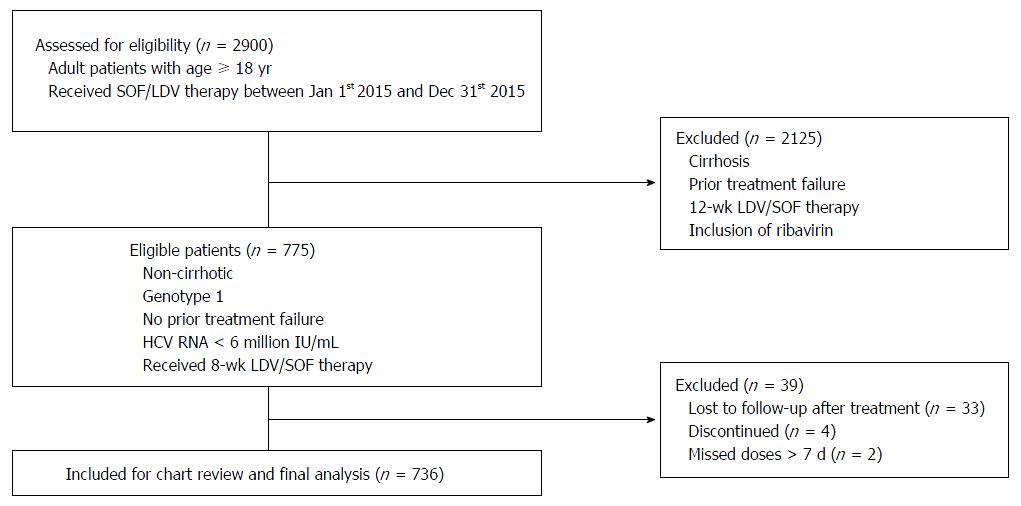
Figure 1 Flow chart of patient selection process.
This flow chart summarizes patient identification for eligibility and inclusion/exclusion criteria.
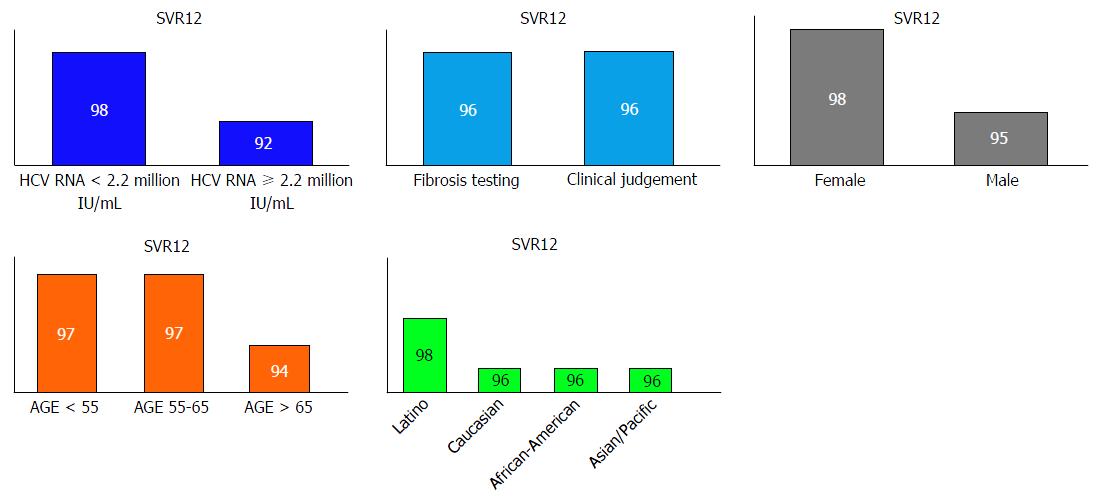
Figure 2 Sustained virologic response rates among patients with various clinical and demographic characteristics.
SVR: Sustained viral response.
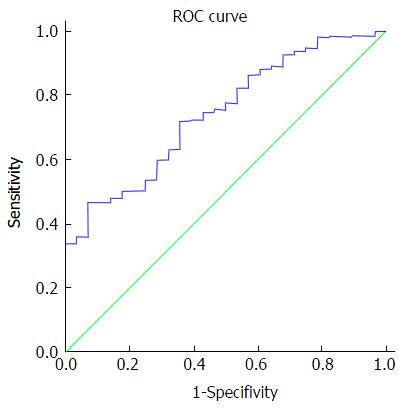
Figure 3 Area under a receiver operating characteristic curve for hepatitis C RNA viral load was 0.
734 (P < 0.001, 95%CI: 0.66-0.82).
- Citation: Latt NL, Yanny BT, Gharibian D, Gevorkyan R, Sahota AK. Eight-week ledipasvir/sofosbuvir in non-cirrhotic, treatment-naïve hepatitis C genotype-1 patients with hepatitis C virus-RNA < 6 million: Single center, real world effectiveness and safety. World J Gastroenterol 2017; 23(26): 4759-4766
- URL: https://www.wjgnet.com/1007-9327/full/v23/i26/4759.htm
- DOI: https://dx.doi.org/10.3748/wjg.v23.i26.4759


