Copyright
©The Author(s) 2017.
World J Gastroenterol. Jul 14, 2017; 23(26): 4735-4743
Published online Jul 14, 2017. doi: 10.3748/wjg.v23.i26.4735
Published online Jul 14, 2017. doi: 10.3748/wjg.v23.i26.4735
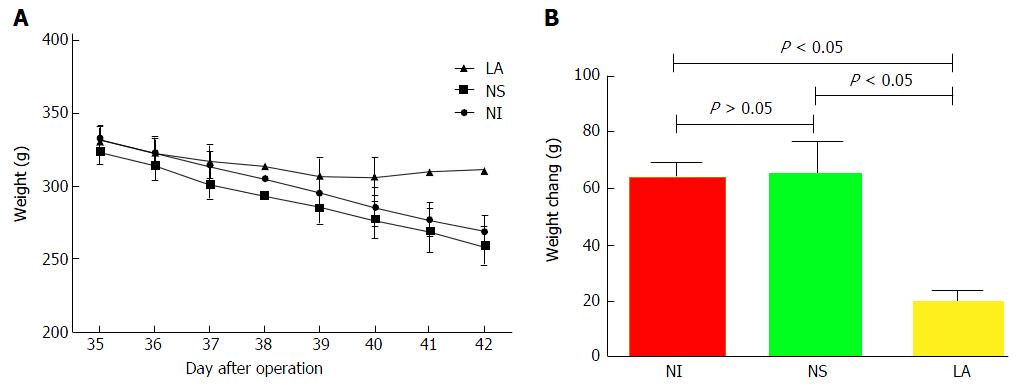
Figure 1 Changes in rat body weight during the experiment.
A: Body weight changes in rats following pouchitis. Weight in the NI (63.50 ± 5.99) and NS groups (64.67 ± 11.93) continued to decline, while weight in the LA group initially decreased and then increased on day 4 of LA lavage (20.17 ± 3.25); B: The differences in body weight among the three groups were statistically significant (F = 61.34, P < 0.05), but there was no significant difference between the NI and NS groups (P > 0.05). NI: No Intervention group; NS: Normal Saline group; LA: Lactobacillus acidophilus group.
Figure 2 Hematochezia in rats.
A: Anal condition of rats in each group at 4 d post-intervention. The NI (a) and NS groups (b) still had hematochezia, but this had disappeared in the LA group (c); B: Recovery was significantly faster in the LA group compared with the NS and NI groups (F = 108.70, P < 0.05). NI: No Intervention group; NS: Normal Saline group; LA: Lactobacillus acidophilus group.
Figure 3 Feces of rats.
A: Stools appeared as loose paste in the NI (a) and NS (b) groups, but were more normal in the LA group (c); B: The fecal score was significantly higher in the LA group compared with the NI (t = 12.30, P < 0.05) and NS groups (t = 13.09, P < 0.05). NI: No Intervention group; NS: Normal Saline group; LA: Lactobacillus acidophilus group.
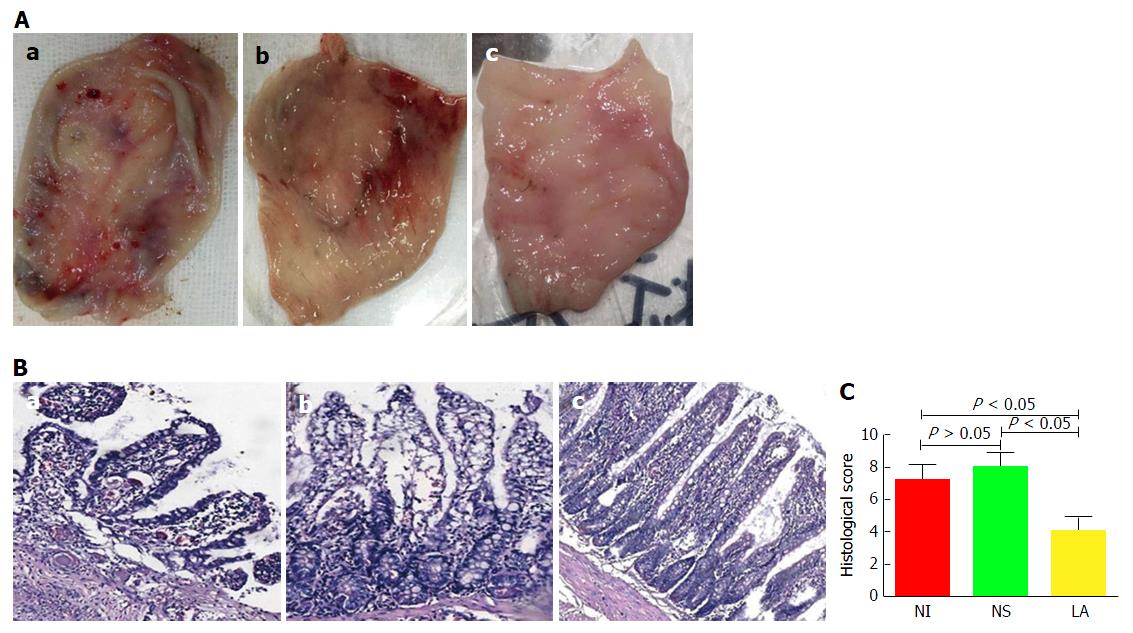
Figure 4 Gross and microscopic histological observations.
A: Mucosal surface congestion and edema, toughness, visible multiple ulcers, and scattered bleeding were evident in the NI (a) and NS (b) groups, but mucosal congestion and edema had disappeared in the LA (c) group; B: Microscopic examination of the pouch revealed irregular and disordered mucosal villi, passivation of the villi, and extensive inflammatory cell infiltration in the central matrix of the villi in the NI (a) and NS (b) groups, but less severe lesions in the LA (c) group; C: There was no significant difference in histological scores between the NI (7.17 ± 0.98) and NS groups (8.00 ± 0.89) (t = 1.536, P > 0.05), but the histological score was significantly lower in the LA group (4.00 ± 0.89) than in the other two groups (F = 5.84, P < 0.05). NI: No Intervention group; NS: Normal Saline group; LA: Lactobacillus acidophilus group.
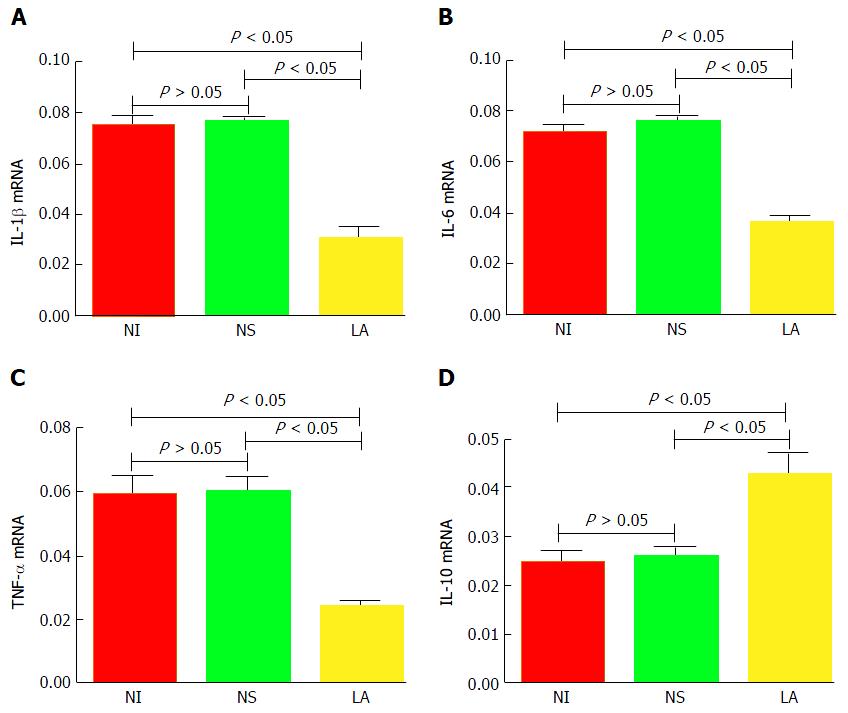
Figure 5 mRNA expression levels.
mRNA levels of IL-1β (A), IL-6 (B), and TNF-α (C) were significantly lower in the LA group compared with the NS and NI groups (F = 373.60, P < 0.05; F = 285.50, P < 0.05; F = 132.90, P < 0.05, respectively), while IL-10 (D) levels were significantly higher (F = 61.05, P < 0.05). IL: Interleukin; TNF-α: Tumor necrosis factor-α; NI: No Intervention group; NS: Normal Saline group; LA: Lactobacillus acidophilus group.
Figure 6 Zonula occludens protein 1 protein expression levels.
A: ZO-1 protein expression levels in the NI (a, d) and NS groups (b, e) were significantly lower than in the LA group (c, f); B: The differences between the three groups were statistically significant (F = 8.23, P < 0.05). ZO-1: Zonula occludens protein 1; NI: No Intervention group; NS: Normal Saline group; LA: Lactobacillus acidophilus group.
- Citation: Xu YY, Zhang YY, He AQ, Li KY, Gao SY, Liu G. Lactobacillus acidophilus alleviates pouchitis after ileal pouch-anal anastomosis in rats. World J Gastroenterol 2017; 23(26): 4735-4743
- URL: https://www.wjgnet.com/1007-9327/full/v23/i26/4735.htm
- DOI: https://dx.doi.org/10.3748/wjg.v23.i26.4735


