Copyright
©The Author(s) 2017.
World J Gastroenterol. Jul 14, 2017; 23(26): 4724-4734
Published online Jul 14, 2017. doi: 10.3748/wjg.v23.i26.4724
Published online Jul 14, 2017. doi: 10.3748/wjg.v23.i26.4724
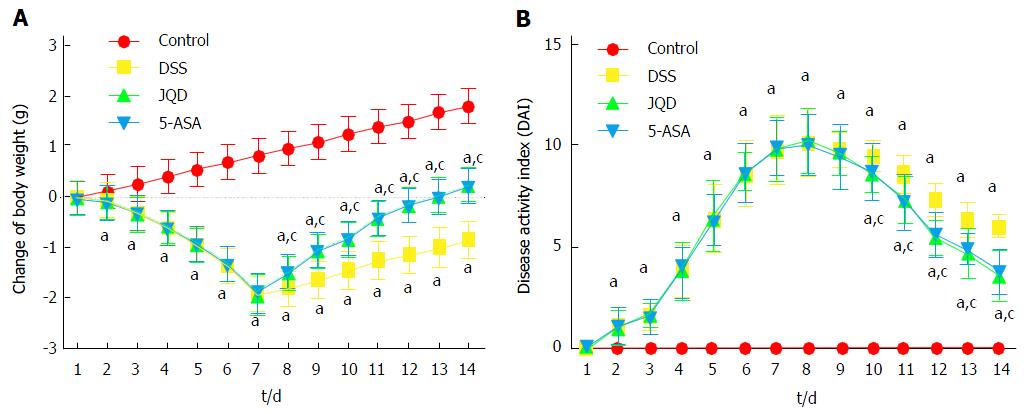
Figure 1 Body weight change and disease activity index of mice.
A: Body weight change (the change of body weight in each group of mice was compared with the body weight in the same group of mice on the 1st day); B: Disease activity index. aP < 0.05 vs control group, cP < 0.05 vs DSS group. 5-ASA: 5-aminosalicylic acid; DSS: Dextran sulfate sodium; JQD: Jianpi Qingchang decoction.
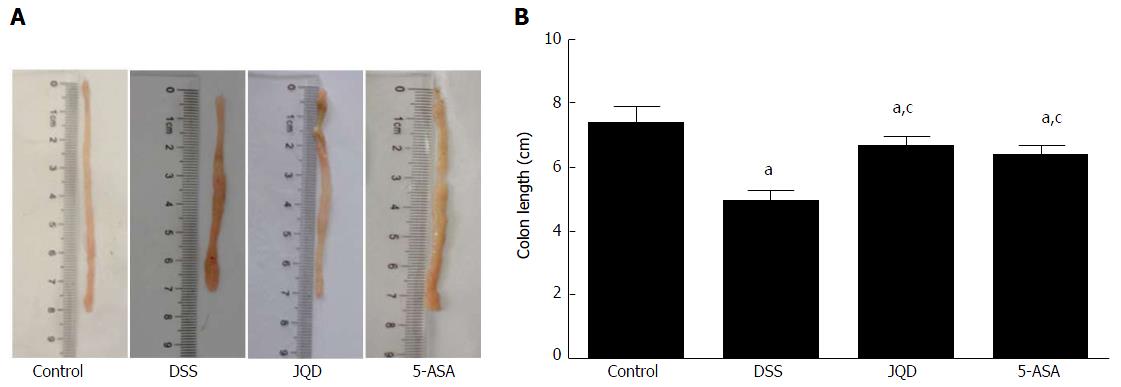
Figure 2 Representative image of colons.
A: Macroscopic appearance; B: Length of colon (from the appendix to the anus). aP < 0.05 vs control group, cP < 0.05 vs DSS group. 5-ASA: 5-aminosalicylic acid; DSS: Dextran sulfate sodium; JQD: Jianpi Qingchang decoction.
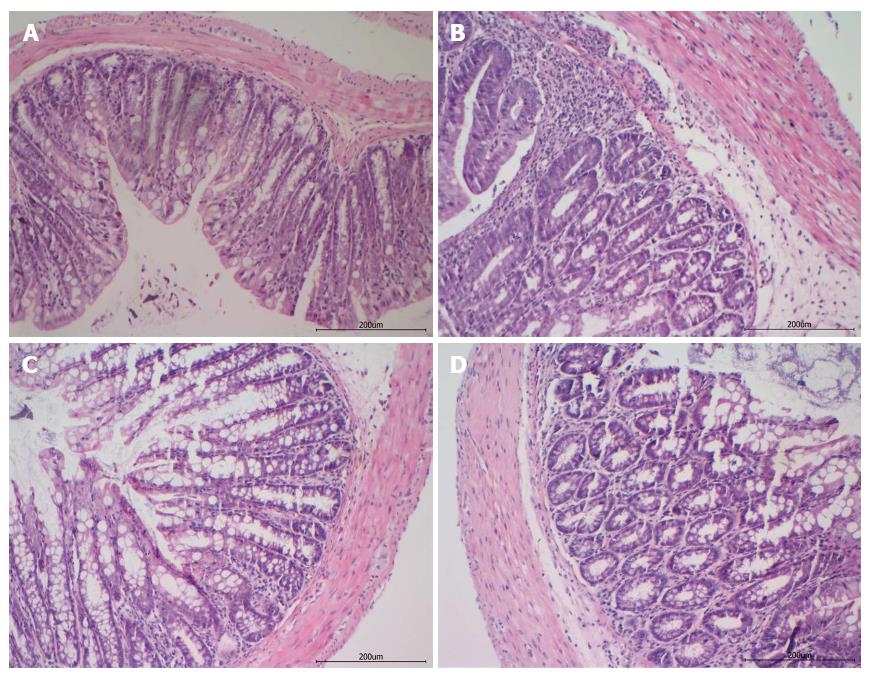
Figure 3 Histologic images of rat colon (H and E, magnification × 200).
A: Control group; B: DSS group; C: JQD group; D: 5-ASA group. 5-ASA: 5-aminosalicylic acid; DSS: Dextran sulfate sodium; JQD: Jianpi Qingchang decoction.
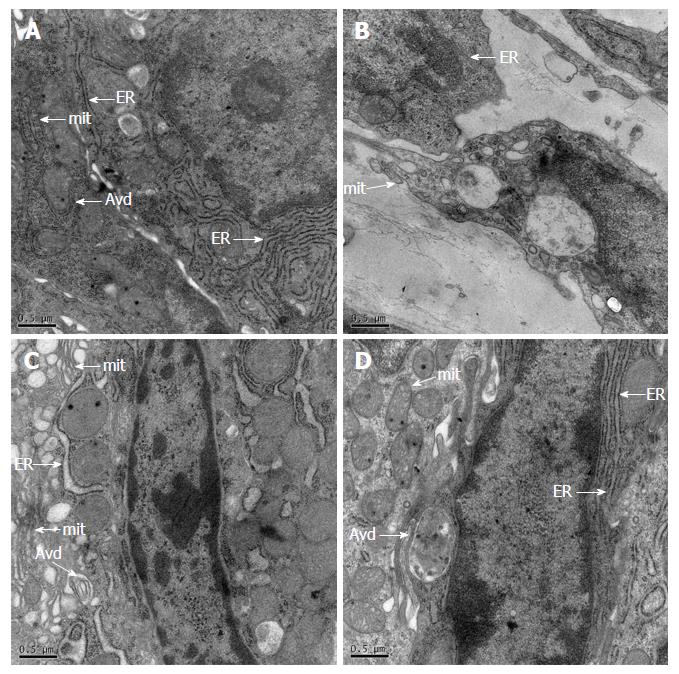
Figure 4 Transmission electron micrographs of interstitial cells of Cajal and autophagosomes in the region of rat proximal colon (magnification × 20000).
A: Control group; B: DSS group; C: JQD group; D: 5-ASA group. 5-ASA: 5-aminosalicylic acid; AVd: Autophagic vacuoles; DSS: Dextran sulfate sodium; ER: Endoplasmic reticulum; JQD: Jianpi Qingchang decoction; mit: Mitochondria.
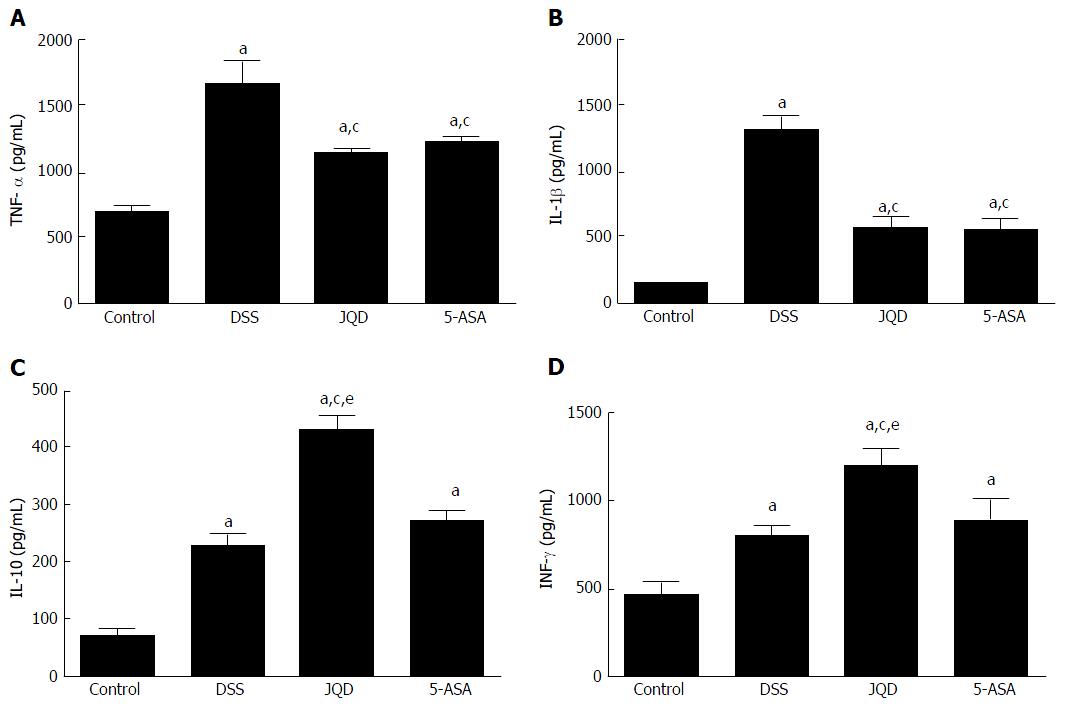
Figure 5 Enzyme linked immunosorbent assay analysis of tumor necrosis factor-alpha, interleukin-1β, interleukin-10 and interferon-gamma expression (n = 6).
A: TNF-α expression in the colon; B: IL-1β expression in the colon; C: IL-10 expression in the colon; D: IFN-γ expression in the colon. aP < 0.05 vs control group, cP < 0.05 vs DSS group, eP < 0.05 vs 5-ASA group. 5-ASA: 5-aminosalicylic acid; DSS: Dextran sulfate sodium; INF-γ: Interferon-gamma; IL: Interleukin; JQD: Jianpi Qingchang decoction; TNF-α: Tumor necrosis factor-alpha.
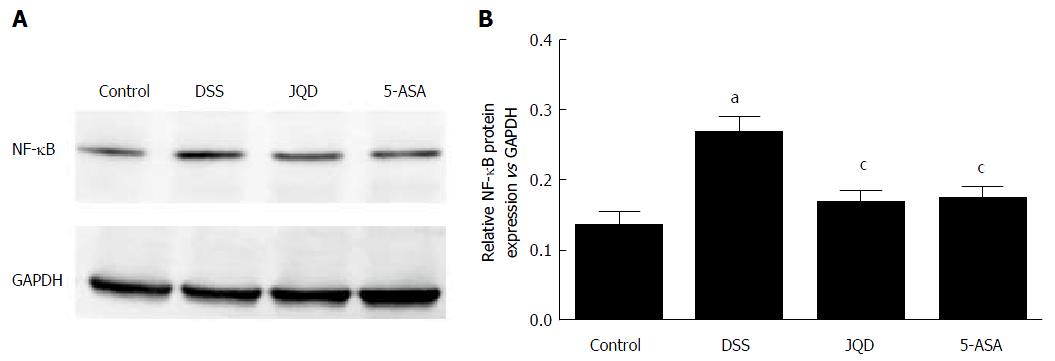
Figure 6 Western blot analysis of nuclear factor-kappa B p65 expression (n = 4).
A: Representative western blots of NF-κB p65. B: Quantitative analysis of NF-κB p65 protein. aP < 0.05 vs control group, cP < 0.05 vs DSS group. 5-ASA: 5-aminosalicylic acid; DSS: Dextran sulfate sodium; JQD: Jianpi Qingchang decoction; NF-κB: Nuclear factor-kappa B; GAPDH: Glyceraldehyde-3-phosphate dehydrogenase.
Figure 7 Real-time PCR analysis of c-kit mRNA, LC-3II mRNA and Beclin-1 mRNA expression (n = 3).
A: c-kit mRNA; B: LC-3II mRNA; C: Beclin-1 mRNA. aP < 0.05 vs control group, cP < 0.05 vs DSS group. 5-ASA: 5-aminosalicylic acid; DSS: Dextran sulfate sodium; JQD: Jianpi Qingchang decoction; LC-3II: Microtubule-associated protein 1 light chain 3.
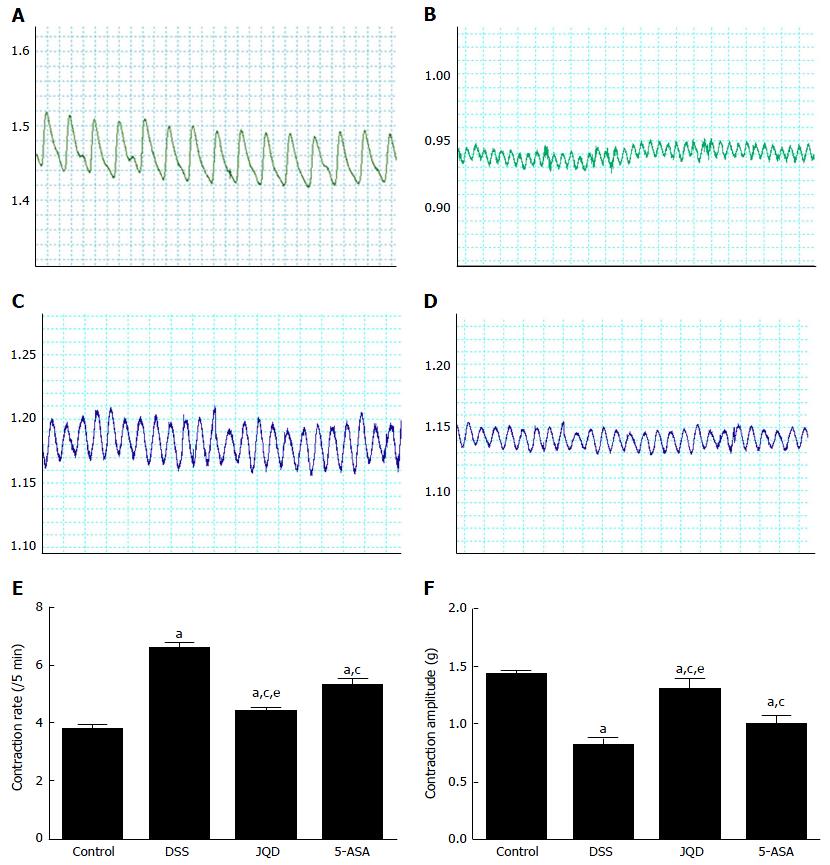
Figure 8 PowerLab analysis on the contraction of colonic smooth muscle in mice (n = 6).
A: Control group; B: DSS group; C: JQD group; D: 5-ASA group; E: Contraction rate (/5 min); F: Contraction amplitude (g). aP < 0.05 vs control group, cP < 0.05 vs DSS group, eP < 0.05 vs 5-ASA group. 5-ASA: 5-aminosalicylic acid; DSS: Dextran sulfate sodium; JQD: Jianpi Qingchang decoction.
- Citation: Dai YC, Zheng L, Zhang YL, Chen X, Chen DL, Wang LJ, Tang ZP. Jianpi Qingchang decoction regulates intestinal motility of dextran sulfate sodium-induced colitis through reducing autophagy of interstitial cells of Cajal. World J Gastroenterol 2017; 23(26): 4724-4734
- URL: https://www.wjgnet.com/1007-9327/full/v23/i26/4724.htm
- DOI: https://dx.doi.org/10.3748/wjg.v23.i26.4724


