Copyright
©The Author(s) 2017.
World J Gastroenterol. Jul 7, 2017; 23(25): 4632-4643
Published online Jul 7, 2017. doi: 10.3748/wjg.v23.i25.4632
Published online Jul 7, 2017. doi: 10.3748/wjg.v23.i25.4632
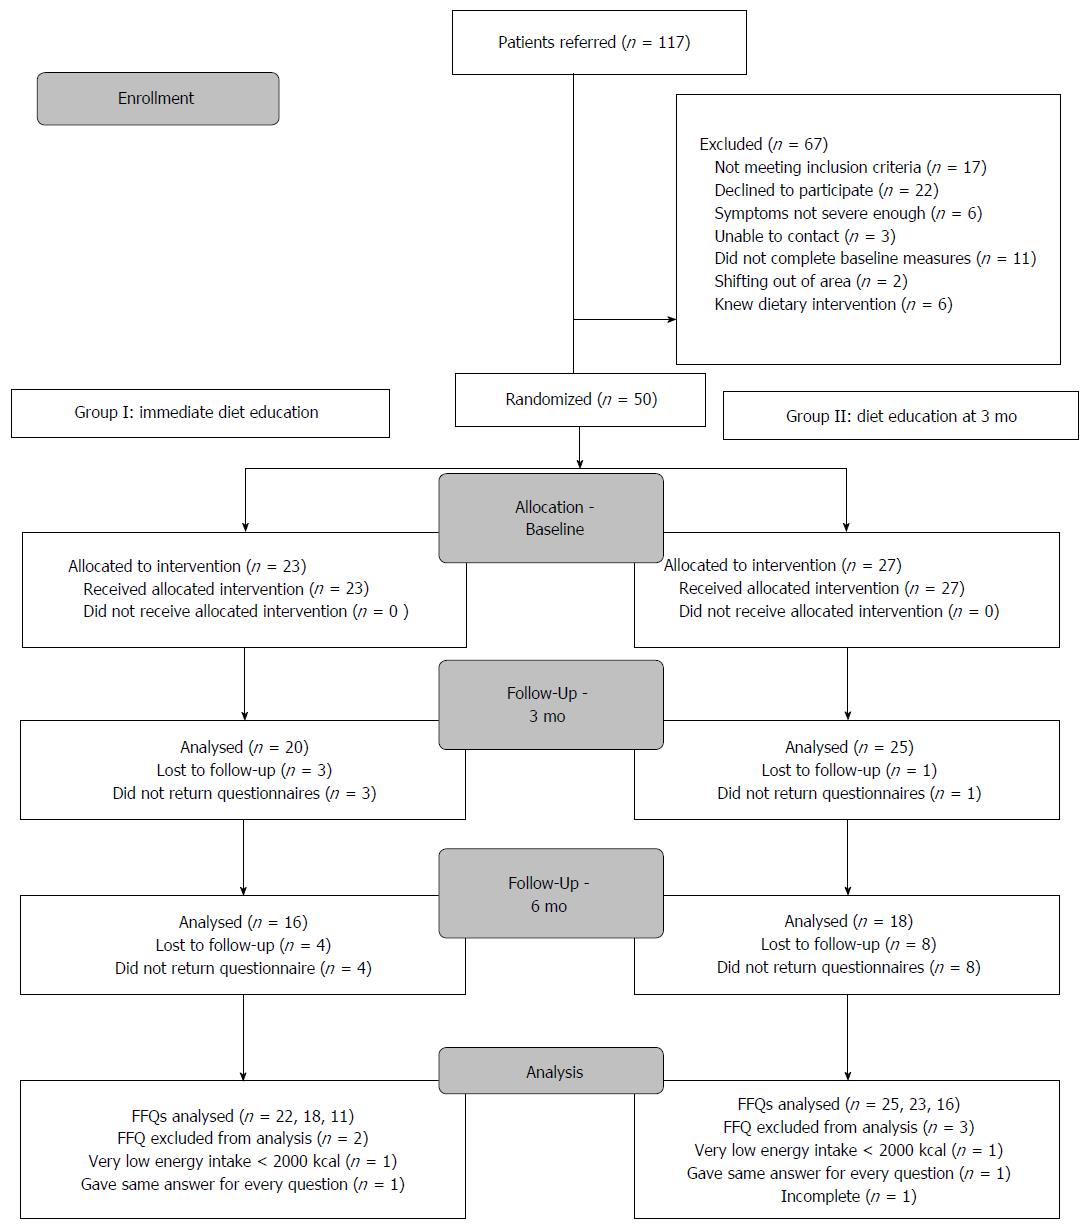
Figure 1 Participant flow.
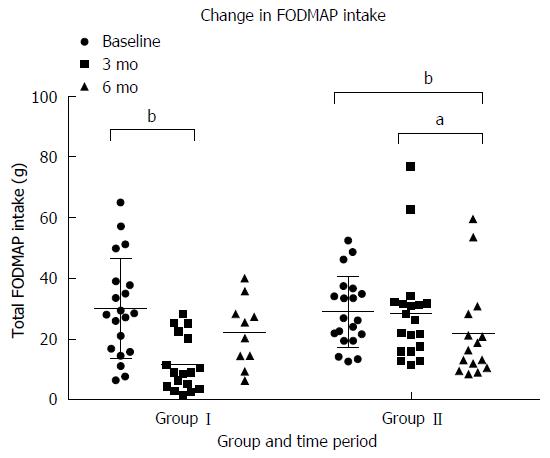
Figure 2 Comparison of total FODMAP intake between group I who received dietary education immediately after randomisation and began reintroducing FODMAP at three months and group II who received dietary education after the collection of the 3-mo data.
Total FODMAP is the sum of galacto-oligosaccharides, fructo-oligosacchardies, lactose, fructose in excess of glucose, sorbitol and mannitol in grams as measured on a FODMAP specific food frequency questionnaire[34]. aP < 0.05, bP < 0.01.
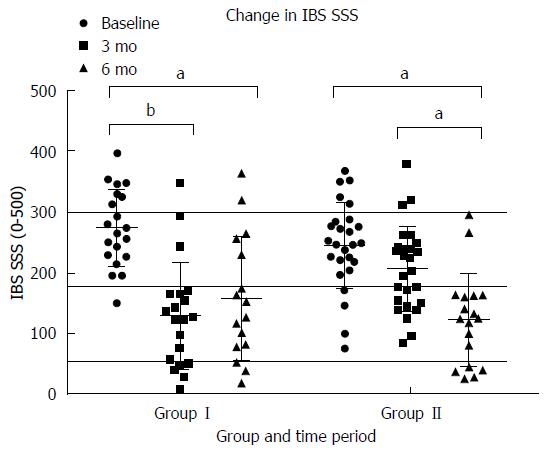
Figure 3 Change in IBS severity scoring system[35] by group and time period.
Participants in Group I received dietary education immediately after baseline measures and started reintroductions to tolerance at 3 mo. Participants in group II received dietary education after collection of data at 3 mo. Scores > 300 indicate severe IBS, 175-300 indicate moderate IBS, 50-175 indicate mild IBS and scores < 50 are similar to those of people without IBS. aP < 0.05, bP < 0.01.
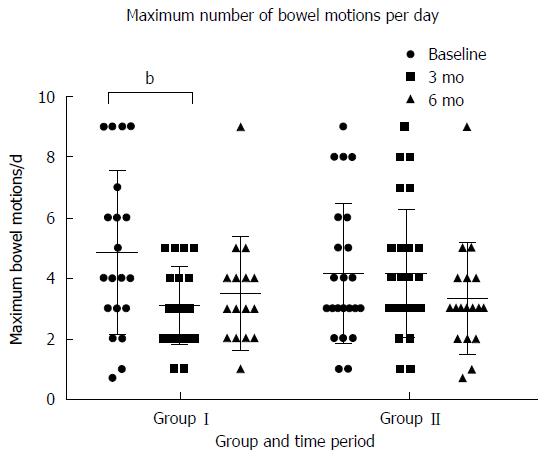
Figure 4 Maximum number of bowel motions reported per day by participants by time period and group.
Group I received their dietary education after the collection of baseline measures and started reintroducing FODMAP to tolerance at 3 mo. Group II received their dietary education after the collection of data at 3 mo. bP < 0.01.
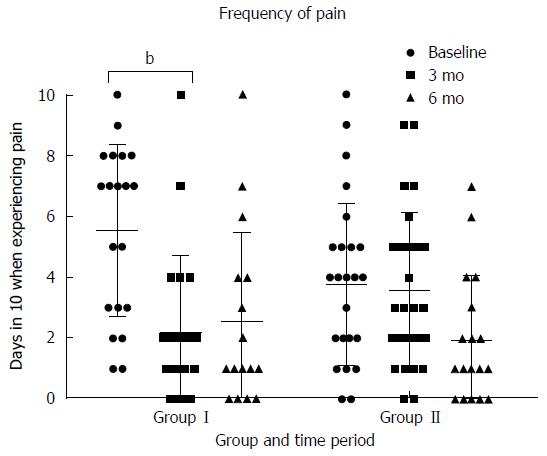
Figure 5 Days in ten when participants were experiencing pain by time period and group.
Participants in Group I received dietary education after collection of baseline measures and at 3 mo were encouraged to reintroduce FODMAP foods to tolerance. Participants in Group II received dietary education after the collection of data at 3 mo. bP < 0.01.
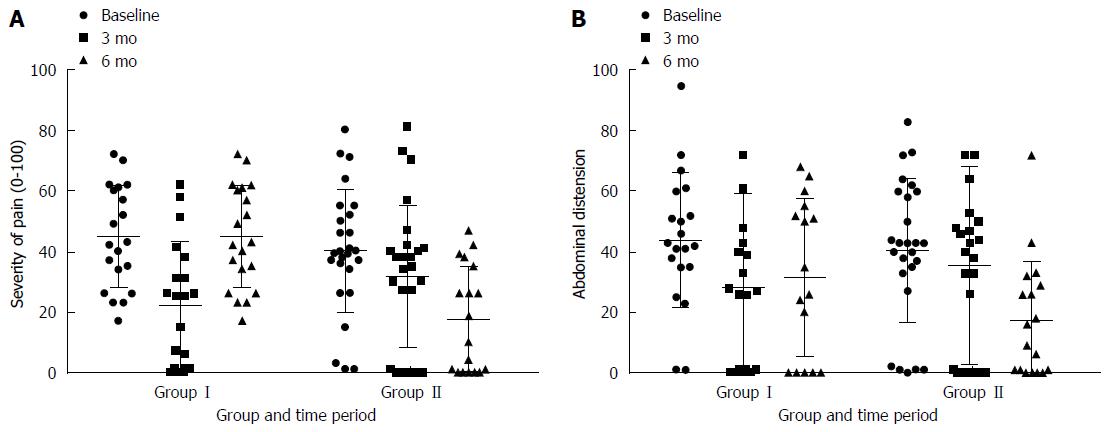
Figure 6 Change in severity of pain (A) and abdominal distension (B) by group and time period.
Increasing scores represent increasing severity. This is a subscale of the irritable bowel syndrome symptom severity scoring system[34]. Participants in group I received dietary education immediately after collecting baseline measures and after 3 mo were reintroducing FODMAPs to tolerance. Participants in Group II received dietary education after the data collection at 3 mo.
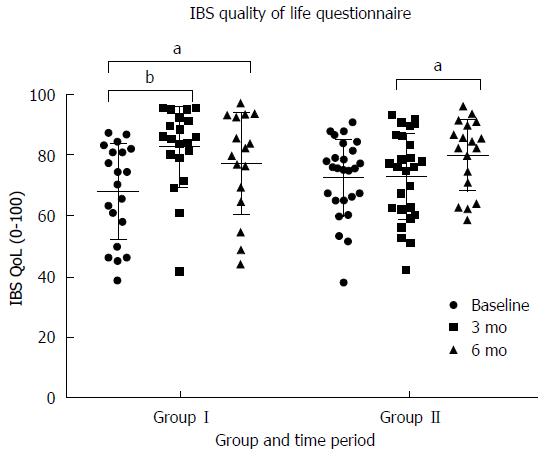
Figure 7 Change in irritable bowel syndrome related quality of life[36] by time period and group.
Participants in group I received dietary education after the collection of baseline measures and started reintroducing FODMAP to tolerance after collecting of data at 3 mo. Group II received their dietary education after the collection of data at 3 mo. aP < 0.05, bP < 0.01.
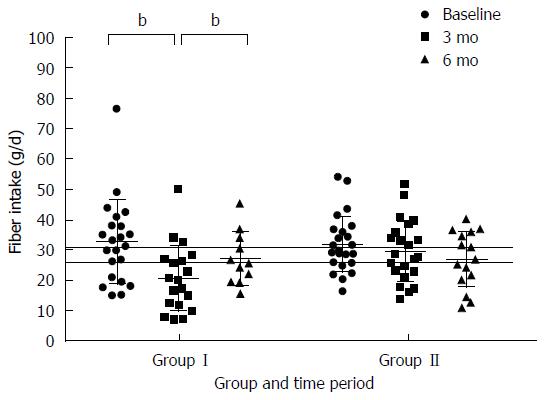
Figure 8 Comparison of total fiber intake between group I who received dietary education immediately after randomisation and began reintroducing FODMAP at three months and group II who received dietary education after the collection of the 3-mo data.
Fiber intake was measured on a food frequency questionnaire[34] previously validated for estimating fibre intakes. Recommended fiber intakes for NZ adult males are 30 g per day and for adult NZ females are 25 g per day as represented by the horizontal lines, bP < 0.01.
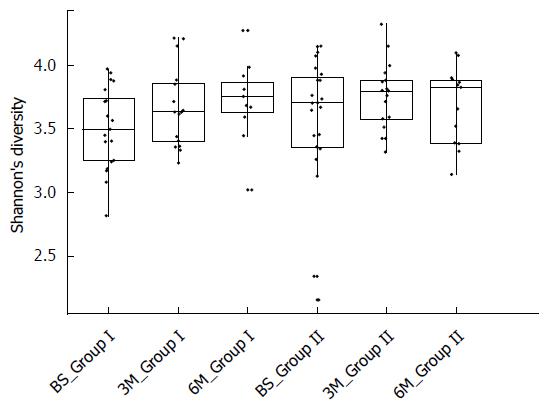
Figure 9 Diversity of samples measured by the Shannon index.
Participants in Group I commenced the low FODMAP diet after collection of the baseline measures and in Group II after the collection of data at three months. Each sample is represented by one dot.
- Citation: Harvie RM, Chisholm AW, Bisanz JE, Burton JP, Herbison P, Schultz K, Schultz M. Long-term irritable bowel syndrome symptom control with reintroduction of selected FODMAPs. World J Gastroenterol 2017; 23(25): 4632-4643
- URL: https://www.wjgnet.com/1007-9327/full/v23/i25/4632.htm
- DOI: https://dx.doi.org/10.3748/wjg.v23.i25.4632


