Copyright
©The Author(s) 2017.
World J Gastroenterol. Jul 7, 2017; 23(25): 4624-4631
Published online Jul 7, 2017. doi: 10.3748/wjg.v23.i25.4624
Published online Jul 7, 2017. doi: 10.3748/wjg.v23.i25.4624
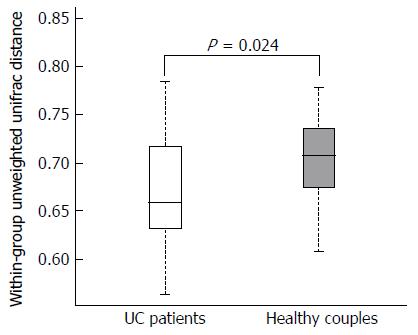
Figure 1 Distributions of the unweighted unifrac distance within the ulcerative colitis patients and healthy partners groups.
Orange and red boxplots denote the distributions of 16S rRNA gene sequencing of fecal samples in ulcerative colitis patients and healthy partners, respectively.
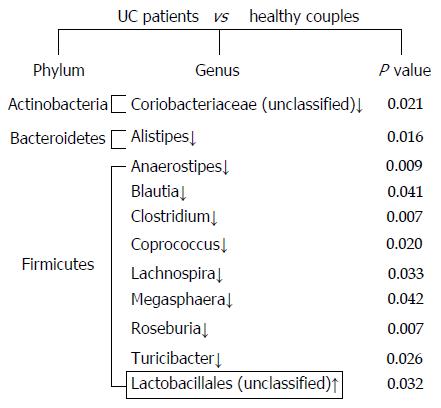
Figure 2 Significant differences in the fecal microbiota composition between ulcerative colitis patients and their healthy partners.
Comparisons for each sample were calculated using the Wilcoxon test. The down arrows indicate less abundant microbiota in ulcerative colitis (UC) patients, and the up arrow represents the more abundant microbiota in UC patients compared with their healthy partners.
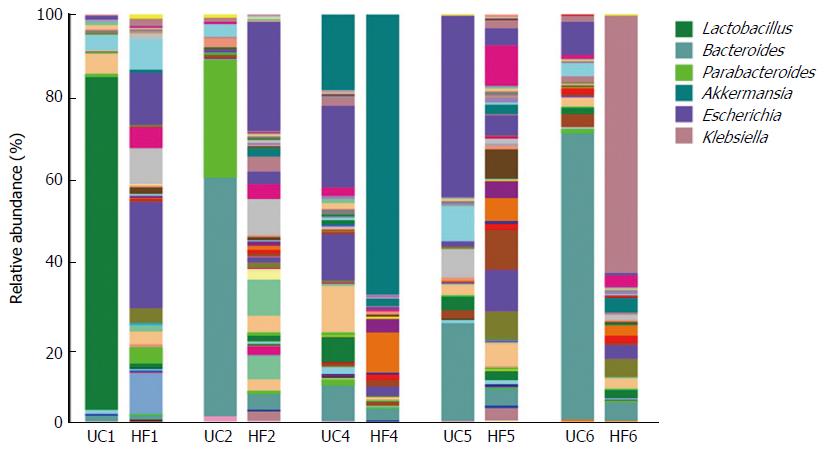
Figure 3 Relative abundance at the genus level, as shown by 16S rRNA gene sequencing, from ulcerative colitis patients and their partners showing a microbiota imbalance.
Each column represents one fecal sample and different colors indicate different genera in the microbiota composition. Microbiota with a substantial proportional imbalance are listed. UC: UC patient; HF: Healthy partners.
- Citation: Chen GL, Zhang Y, Wang WY, Ji XL, Meng F, Xu PS, Yang NM, Ye FQ, Bo XC. Partners of patients with ulcerative colitis exhibit a biologically relevant dysbiosis in fecal microbial metacommunities. World J Gastroenterol 2017; 23(25): 4624-4631
- URL: https://www.wjgnet.com/1007-9327/full/v23/i25/4624.htm
- DOI: https://dx.doi.org/10.3748/wjg.v23.i25.4624


