Copyright
©The Author(s) 2017.
World J Gastroenterol. Jul 7, 2017; 23(25): 4517-4528
Published online Jul 7, 2017. doi: 10.3748/wjg.v23.i25.4517
Published online Jul 7, 2017. doi: 10.3748/wjg.v23.i25.4517
Figure 1 The oscillator circuit, printed circuit board layout, and enhanced electrogastrography capsule body.
Dimensions of the circuit board were 10 mm × 6 mm, which allowed it to fit inside the capsule body that had dimensions 19 mm × 10 mm. Size of the board was constrained by component choice, as well as the need for swelling polymers surrounding the capsule body.
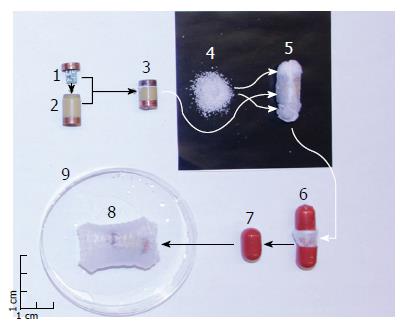
Figure 2 Breakdown of the enhanced electrogastrography gastric retentive pill.
The oscillator circuit was first sealed into the assembled capsule, and added to superabsorbent granules held in a liquid-permeable mesh. This was inserted into a dissolvable pill, which completely disintegrated in the stomach after 10 min, allowing the granules to swell. A mm scale is provided on the left of the image. 1: Oscillator circuit; 2: Capsule body; 3: Assembled capsule; 4; Superabsorbent granules; 5: Capsule and granules inside a liquid-permeable mesh; 6: Dissolvable pill containing the mesh enclosed capsule; 7: Enhanced electrogastrography gastric retentive pill; 8: Pill expanded in water; 9: Test dish.
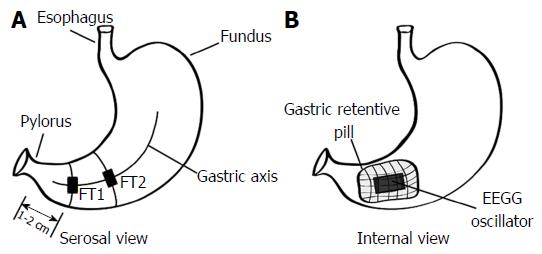
Figure 3 The serosal view of the stomach showing the placement of the force transducers (A), and the internal view of the stomach showing the position of the enhanced electrogastrography capsule and gastric retentive mesh (B).
EEGG: Enhanced electrogastrography.
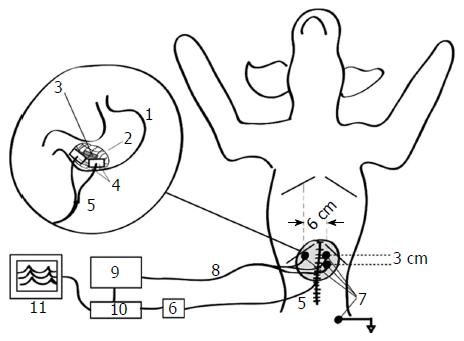
Figure 4 Overall gastric retentive pill-based experimental setup.
1: Stomach; 2: Gastric retentive mesh; 3: Enhanced electrogastrography capsule; 4: Implanted force transducers; 5: Connecting wire from force transducers; 6: Custom bridge amplifier; 7: Cutaneous electrodes; 8: Receiving wires from electrocardiography electrodes; 9: Isolated bioelectric amplifier; 10: Analog-to-digital converter; 11: Real-time data acquisition software.
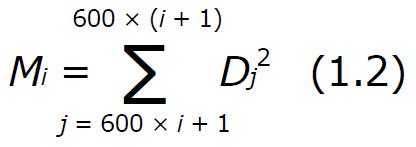
Math 1 Math(A1).
Figure 5 An oscilloscope reading from the gastric serosa prior to the force transducer implantation verified the presence of an activated enhanced electrogastrography pill inside the stomach (A).
The sham pills did not demonstrate any signal (B).
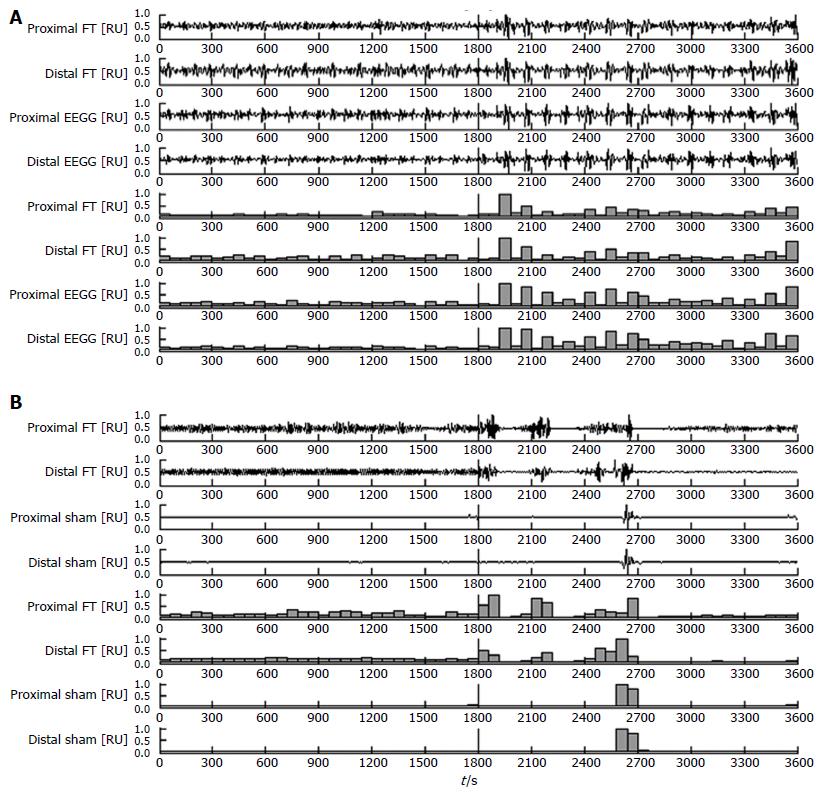
Figure 6 Combined plot of the raw signals and the one-minute motility indices for an active pill (A) and an inactive pill (B) in the baseline state (0-1800) and post-neostigmine administration (1800-3600).
A vertical line denotes the administration of neostigmine. Measurements are normalized and displayed in relative units (RU). EEGG: Enhanced electrogastrography; FT: Force transducer.
- Citation: Poscente MD, Mintchev MP. Enhanced electrogastrography: A realistic way to salvage a promise that was never kept? World J Gastroenterol 2017; 23(25): 4517-4528
- URL: https://www.wjgnet.com/1007-9327/full/v23/i25/4517.htm
- DOI: https://dx.doi.org/10.3748/wjg.v23.i25.4517


