Copyright
©The Author(s) 2017.
World J Gastroenterol. Jun 14, 2017; 23(22): 4072-4079
Published online Jun 14, 2017. doi: 10.3748/wjg.v23.i22.4072
Published online Jun 14, 2017. doi: 10.3748/wjg.v23.i22.4072
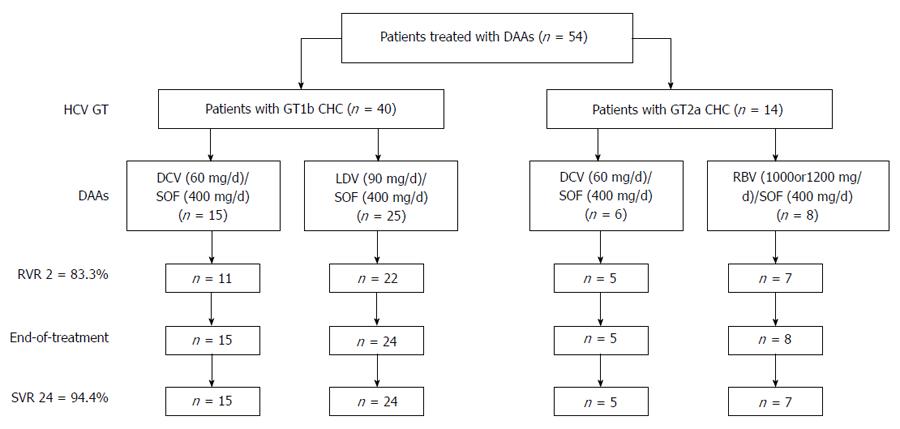
Figure 1 Diagram of detailed treatment regimens for 54 chronic hepatitis C patients and the treatment efficacy.
CHC: Chronic hepatitis C; RVR 2: Rapid virological response at 2 wk after treatment initiation; SVR 24: Sustained virological response at 24 wk after the end of treatment.
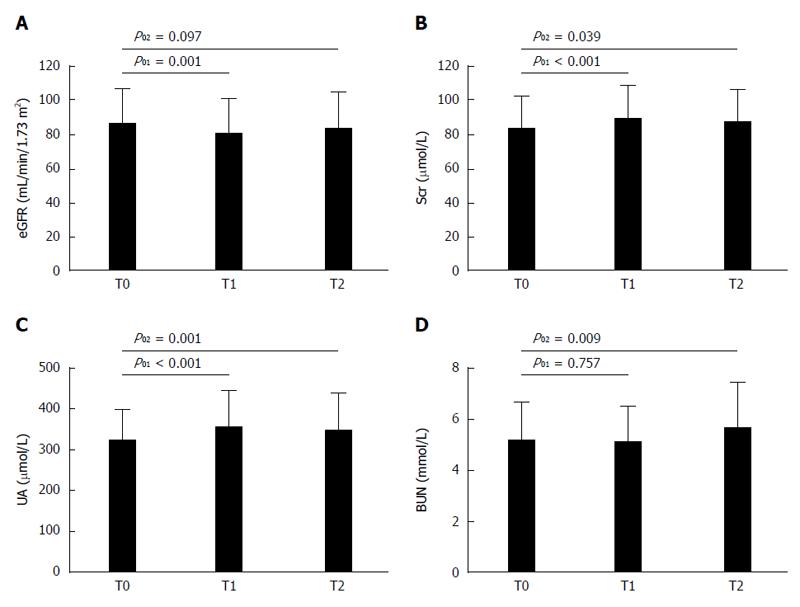
Figure 2 Changes of renal function indices among different observing points.
A: eGFR; B: Scr; C: UA; D: BUN. T0: Baseline; T1: End of treatment; T2: 24 wk after the end of treatment. eGFR: Estimated glomerular filtration rate; Scr: Serum creatinine; UA: Uric acid; BUN: Blood urea nitrogen.
- Citation: Chen JH, Zeng Z, Zhang XX, Zhang Y, Zhang RW, Wang S, Wu CH, Yu M, Liu D, Xi HL, Zhou YX, An YY, Xu XY. Efficacy and safety of combined directly acting antivirals for treatment of Chinese chronic hepatitis C patients in a real-world setting. World J Gastroenterol 2017; 23(22): 4072-4079
- URL: https://www.wjgnet.com/1007-9327/full/v23/i22/4072.htm
- DOI: https://dx.doi.org/10.3748/wjg.v23.i22.4072


