Copyright
©The Author(s) 2017.
World J Gastroenterol. May 28, 2017; 23(20): 3713-3720
Published online May 28, 2017. doi: 10.3748/wjg.v23.i20.3713
Published online May 28, 2017. doi: 10.3748/wjg.v23.i20.3713
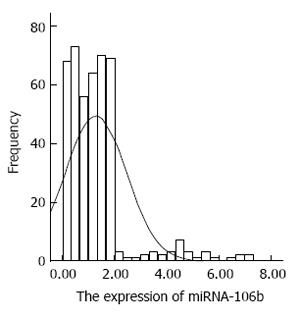
Figure 1 Serum miRNA-106b levels of patients that underwent health checkups.
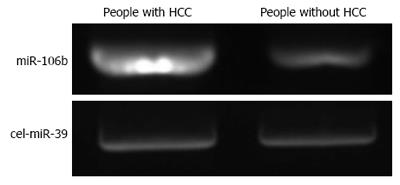
Figure 2 Results of qPCR.
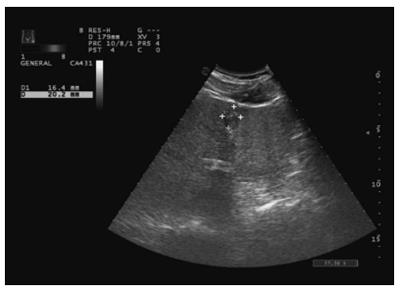
Figure 3 Early hepatocellular carcinoma B-ultrasound results.
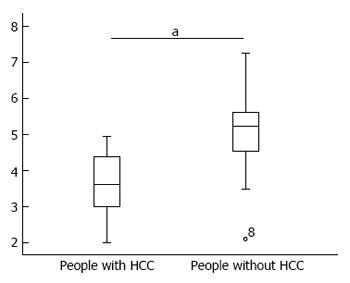
Figure 4 Difference in miRNA-106b expression levels between the two groups were statistically significant (aP < 0.
001).
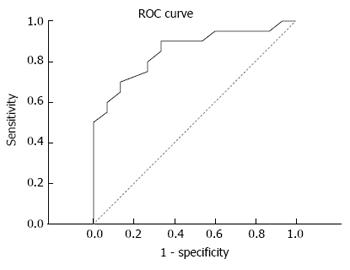
Figure 5 Receiver operating characteristic curve analysis of the differences in miRNA-106b expression.
- Citation: Shi BM, Lu W, Ji K, Wang YF, Xiao S, Wang XY. Study on the value of serum miR-106b for the early diagnosis of hepatocellular carcinoma. World J Gastroenterol 2017; 23(20): 3713-3720
- URL: https://www.wjgnet.com/1007-9327/full/v23/i20/3713.htm
- DOI: https://dx.doi.org/10.3748/wjg.v23.i20.3713


