Copyright
©The Author(s) 2017.
World J Gastroenterol. May 14, 2017; 23(18): 3279-3286
Published online May 14, 2017. doi: 10.3748/wjg.v23.i18.3279
Published online May 14, 2017. doi: 10.3748/wjg.v23.i18.3279
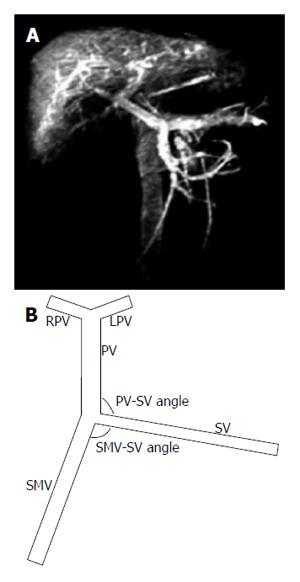
Figure 1 Geometry of the portal vein system.
A: Enhanced CT of the portal vein (PV) system; B: Geometry of the idealized PV model. SV: Splenic vein; SMV: Superior mesenteric vein; LPV: Left PV; RPV: Right PV.
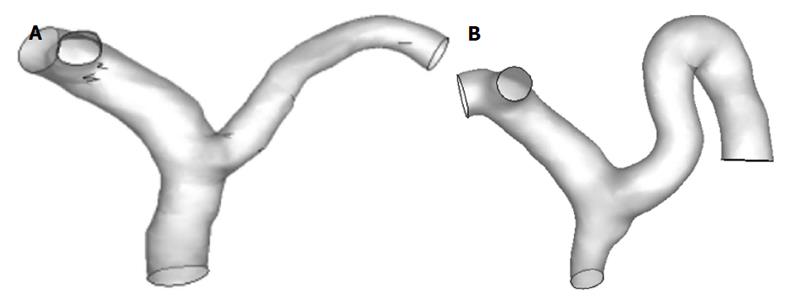
Figure 2 Geometry of the patient-specific portal vein model.
A: Healthy control; B: Cirrhotic patient with portal hypertension.
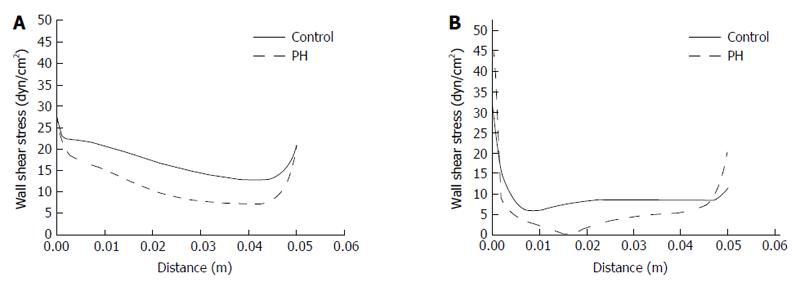
Figure 3 Wall shear stress distribution in right wall (A) and left wall (B) in the healthy control and portal hypertension groups.
The X axis shows the length of the side wall of the PV, starting from 0 in the junction of SV and SMV. The Y axis shows WSS. SV: Splenic vein; SMV: Superior mesenteric vein.
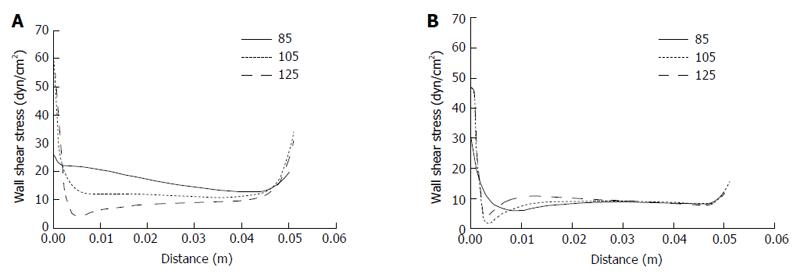
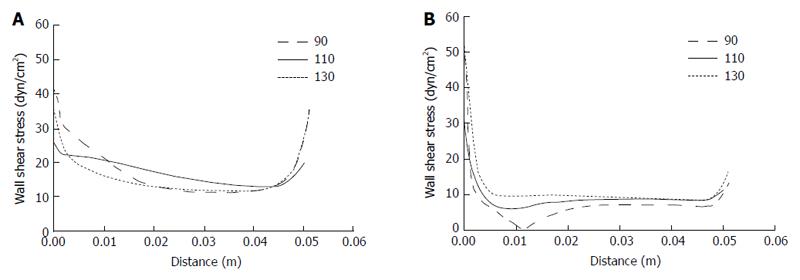
Figure 4 Wall shear stress distribution in right wall (A) and left wall (B) for different superior mesenteric vein-splenic vein angles.
The X axis shows the length of the side wall of PV, starting from 0 in the junction of SV and SMV. The Y axis shows WSS. SV: Splenic vein; SMV: Superior mesenteric vein.
Figure 5 Wall shear stress distribution in right wall (A) and left wall (B) for different portal vein-splenic vein angles.
The X axis shows the length of the side wall of PV, starting from 0 in the junction of SV and SMV. The Y axis shows WSS. SV: Splenic vein; SMV: Superior mesenteric vein.
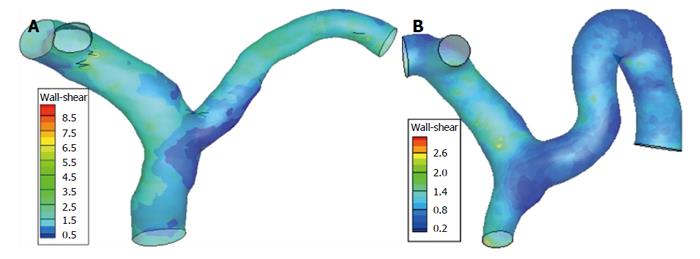
Figure 6 Portal vein system wall shear stress distribution in healthy controls (A) and cirrhotic patients with portal hypertension (B).
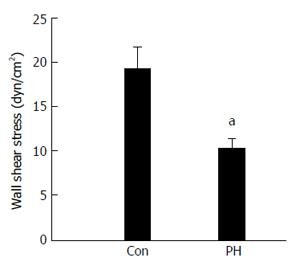
Figure 7 Mean wall shear stress of portal vein in healthy controls (Con) and cirrhotic patients with portal hypertension.
aP < 0.05 vs healthy controls.
- Citation: Wei W, Pu YS, Wang XK, Jiang A, Zhou R, Li Y, Zhang QJ, Wei YJ, Chen B, Li ZF. Wall shear stress in portal vein of cirrhotic patients with portal hypertension. World J Gastroenterol 2017; 23(18): 3279-3286
- URL: https://www.wjgnet.com/1007-9327/full/v23/i18/3279.htm
- DOI: https://dx.doi.org/10.3748/wjg.v23.i18.3279


