Copyright
©The Author(s) 2017.
World J Gastroenterol. Apr 21, 2017; 23(15): 2696-2704
Published online Apr 21, 2017. doi: 10.3748/wjg.v23.i15.2696
Published online Apr 21, 2017. doi: 10.3748/wjg.v23.i15.2696
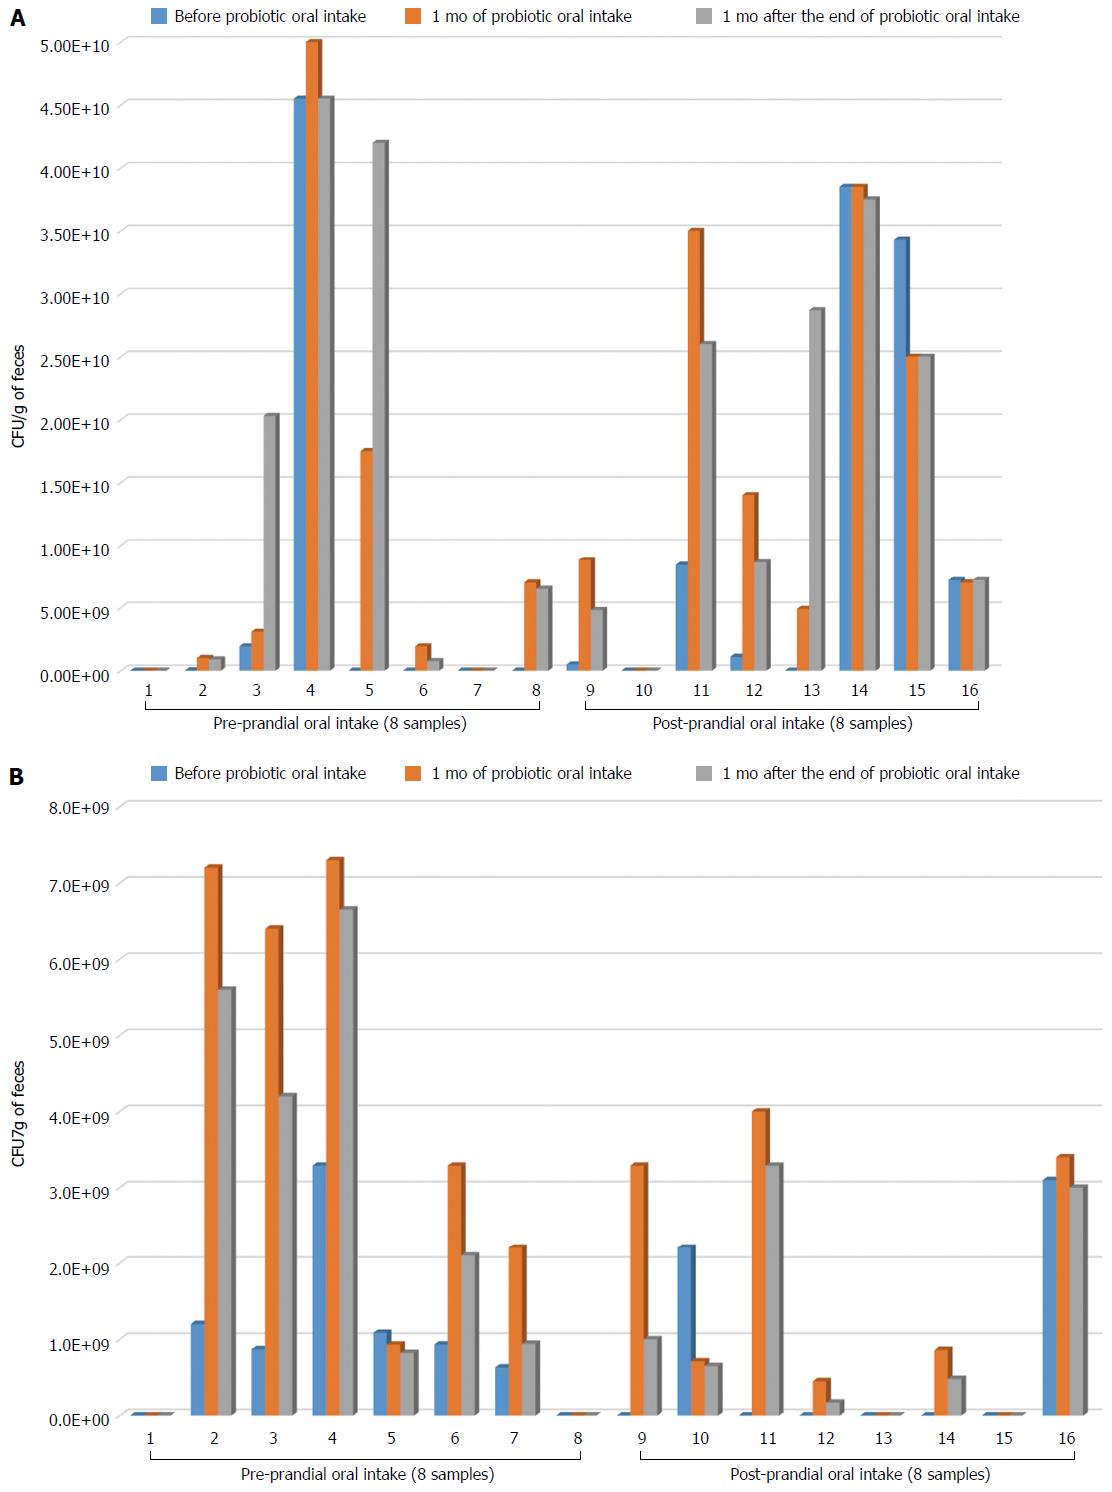
Figure 1 Colonization ability of Bifidobacterium longum BB536 (A) and Lactobacillus rhamnosus HN001 (B).
Bar graphs represent the abundance of each bacterial strain, expressed as colony-forming unit per gram of feces (CFU/g feces), recovered from each subject belonging to the pre-prandial group and post-prandial group.
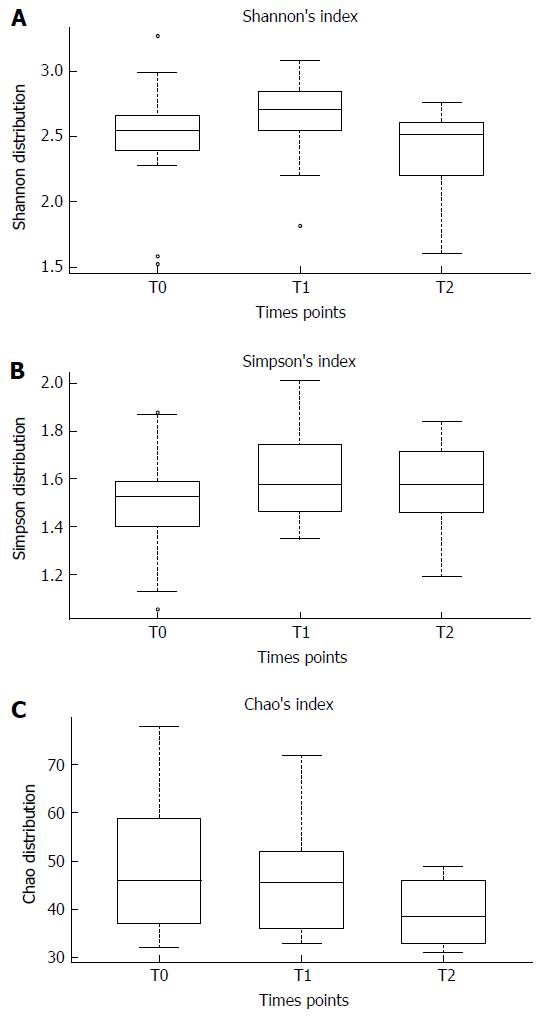
Figure 2 The Shannon (A), Simpson (B) and Chao’s (C) indices before probiotic oral intake (T0), one month after probiotic administration (T1) and one month after the end (T2) of Lactobacillus rhamnosus HN001 and Bifidobacterium longum BB536 consumption.
Mann-Whitney tests were performed for each pair wise comparison and the Kruskal-Wallis test across all three groups.
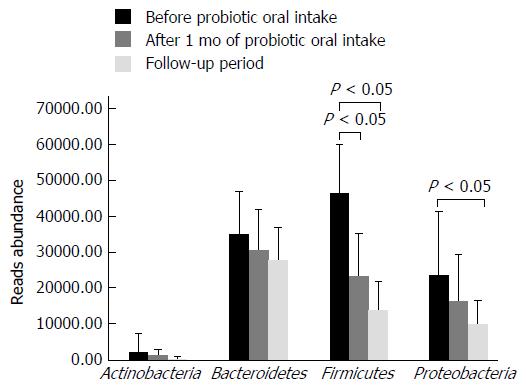
Figure 3 Distribution of the main bacterial phyla detected in fecal samples before Lactobacillus rhamnosus HN001 and Bifidobacterium longum BB536 consumption, after one month of probiotic administration and one month after the end of probiotic oral intake.
Any significant reduction is indicated by an asterisk (P < 0.05).
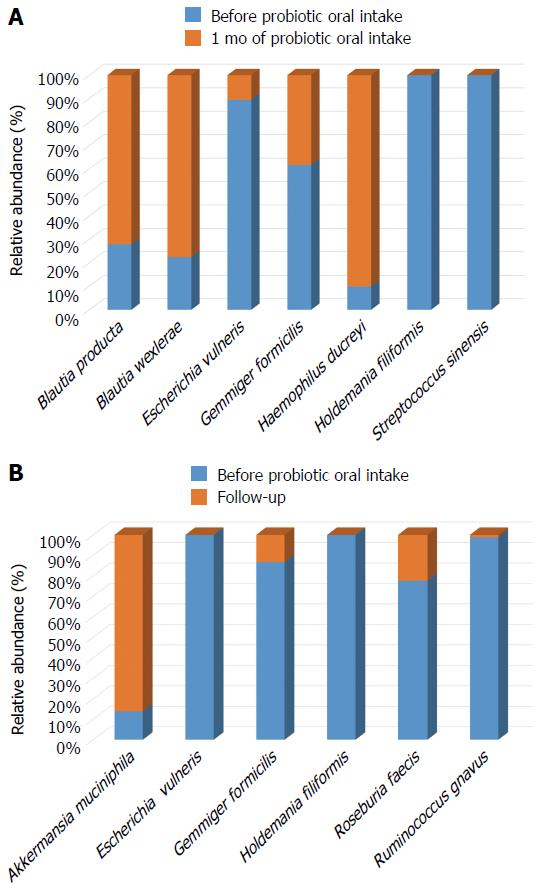
Figure 4 Significant changes in the gut bacterial species composition: (A) bacterial distribution after 1 mo of probiotic oral intake; (B) bacterial distribution one month after the end of probiotic (follow up) (P < 0.
05).
- Citation: Toscano M, De Grandi R, Stronati L, De Vecchi E, Drago L. Effect of Lactobacillus rhamnosus HN001 and Bifidobacterium longum BB536 on the healthy gut microbiota composition at phyla and species level: A preliminary study. World J Gastroenterol 2017; 23(15): 2696-2704
- URL: https://www.wjgnet.com/1007-9327/full/v23/i15/2696.htm
- DOI: https://dx.doi.org/10.3748/wjg.v23.i15.2696


