Copyright
©The Author(s) 2017.
World J Gastroenterol. Mar 28, 2017; 23(12): 2175-2184
Published online Mar 28, 2017. doi: 10.3748/wjg.v23.i12.2175
Published online Mar 28, 2017. doi: 10.3748/wjg.v23.i12.2175
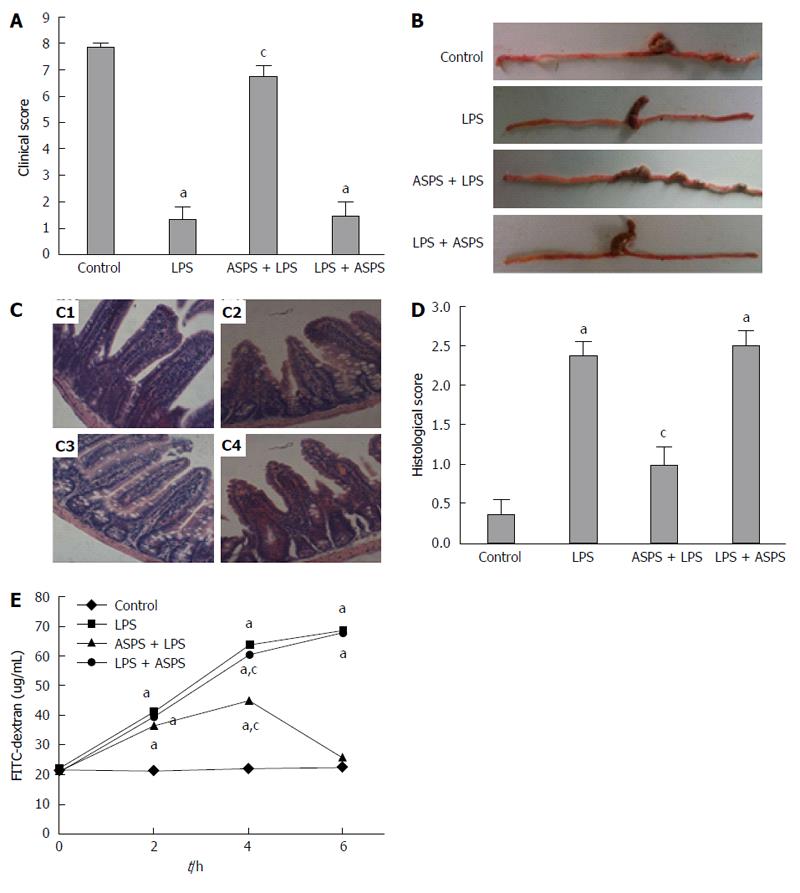
Figure 1 Effects of acanthopanax senticosus polysaccharides on clinical score, macroscopic features of distal ileum and colon, histological appearance and score of distal ileum in lipopolysaccharide-induced mice.
A: Mice were assessed for clinical score at designated time points after lipopolysaccharide (LPS) challenge (n = 8); B: Representative photographs of the distal ileums and colons at 6 h after LPS injection (n = 8); C: Effects of acanthopanax senticosus polysaccharides (ASPS) on LPS-induced intestinal histopathologic changes. Ileum was processed for morphological and histopathologic evaluation at 6 h after LPS induction (n = 3). The representative photomicrographs of ileal segments stained with hematoxylin and eosin at 200 × magnification of C1, control group; C2, LPS group; C3, ASPS + LPS group; and C4, LPS + ASPS group; D: Intestinal histopathologic score was determined at 6 h after LPS challenge (n = 3); E: Effects of ASPS on LPS-induced increase in iliac mucosal permeability. The intestinal permeability of 4 kDa fluorescein isothiocyanate (FITC)-dextran in ileal pouch was measured at 2, 4 and 6 h after LPS administration (n = 8). aP < 0.05, vs the control group; cP < 0.05, vs the LPS group.
Figure 2 Localization and expression of tight junction proteins, and tight junction proteins ultrastructure in ileum were evaluated 6 h after lipopolysaccharide administration in mice of four groups.
A: Effects of Acanthopanax senticosus polysaccharides (ASPS) on distribution of occludin and ZO-1. Staining of both proteins along the villous epithelium at a 200 × magnification (red fluorescence) were observed by immunofluorescence. Nuclei were stained by DAPI (blue fluorescence). Arrows indicate the location of tight junction (TJ) proteins staining; B: Effects of ASPS on intestinal TJ proteins expression of occludin and ZO-1 (n = 3). Protein samples were analyzed by western blotting, and β-actin was used as an internal control. The values are presented as mean ± SE. aP < 0.05, vs the control group; cP < 0.05, vs the LPS group; C: Effects of ASPS on intestinal TJ ultrastructure in ileum viewed under transmission electron microscope of C1, control group; C2, LPS group; C3, ASPS + LPS group; and C4, LPS + ASPS group. Arrows indicate the location of the TJ (scale bar = 1 μm).
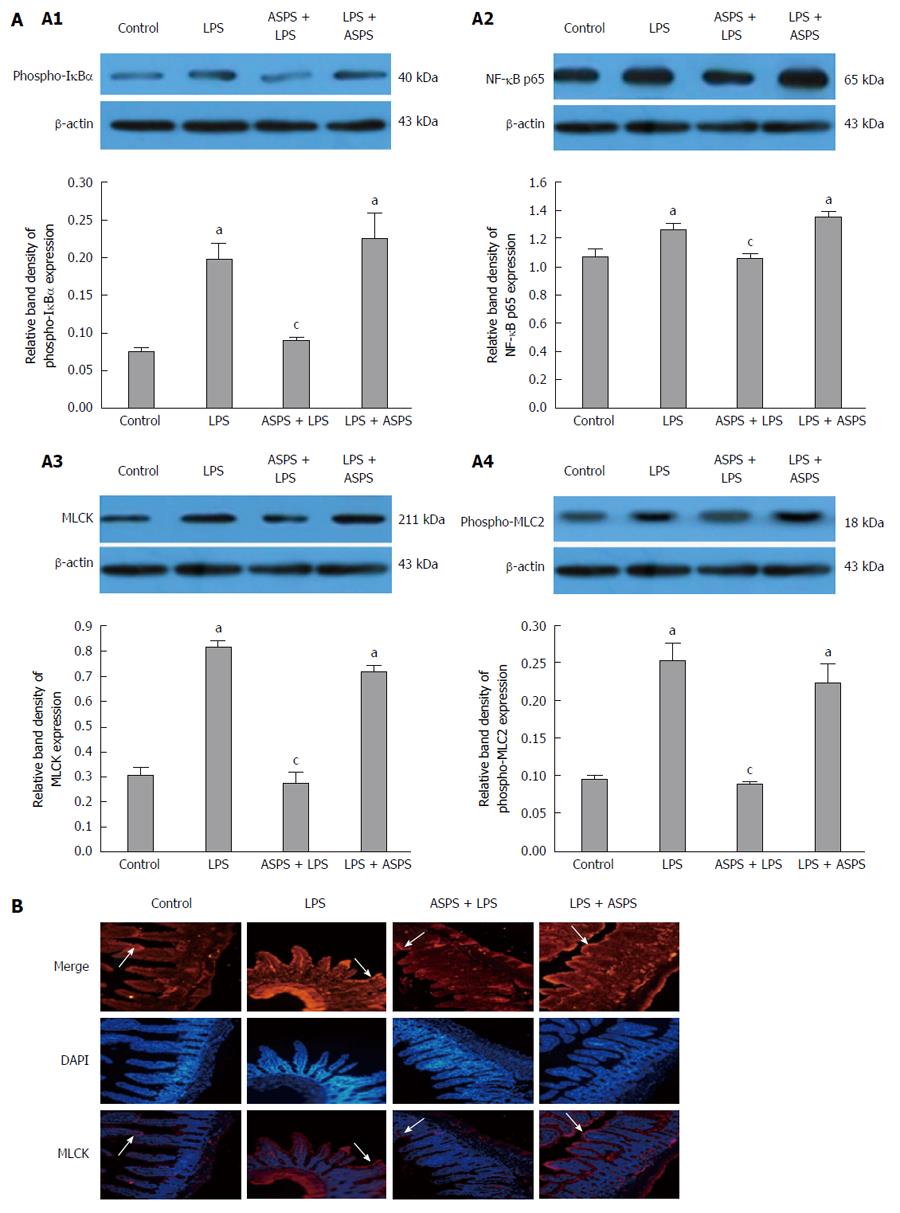
Figure 3 Protein expression of phospho-IκBα, nuclear factor-kappa B p65, myosin light chain kinase and phospho-MLC2 (A) and MLCK localization (B) in ileum epithelium.
A: Protein expression of phospho-IκBα (A1), nuclear factor-kappa B (NF-κB) p65 (A2), myosin light chain kinase (MLCK) (A3) and phospho-MLC2 (A4) were analyzed by western blotting at 6 h after lipopolysaccharide (LPS) induction, and β-actin was used as internal control (n = 3). Data are shown as mean ± SE (n = 3). aP < 0.05, vs the control group; cP < 0.05, vs the LPS group; B: MLCK location was observed by immunofluorescence at 6 h after LPS administration at 200 × magnification (red fluorescence) (n = 3). Nuclei were stained by DAPI (blue fluorescence).
- Citation: Han J, Li JH, Bai G, Shen GS, Chen J, Liu JN, Wang S, Liu XJ. Acanthopanax senticosus polysaccharides-induced intestinal tight junction injury alleviation via inhibition of NF-κB/MLCK pathway in a mouse endotoxemia model. World J Gastroenterol 2017; 23(12): 2175-2184
- URL: https://www.wjgnet.com/1007-9327/full/v23/i12/2175.htm
- DOI: https://dx.doi.org/10.3748/wjg.v23.i12.2175


