Copyright
©The Author(s) 2017.
World J Gastroenterol. Mar 21, 2017; 23(11): 2068-2076
Published online Mar 21, 2017. doi: 10.3748/wjg.v23.i11.2068
Published online Mar 21, 2017. doi: 10.3748/wjg.v23.i11.2068
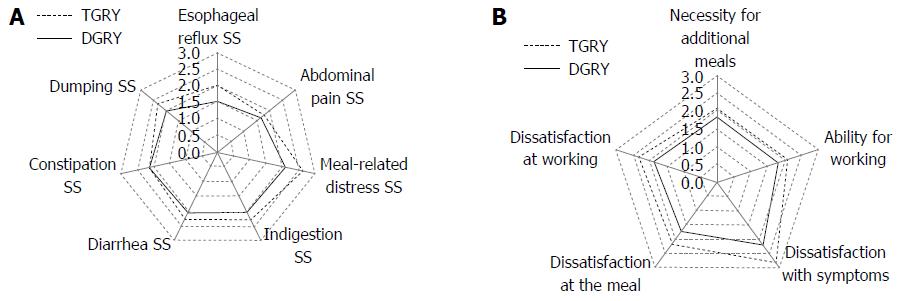
Figure 1 Rader charts of Postgastrectomy Syndrome Assessment Scale symptom subscales, life status, and dissatisfactions.
A: Twenty-three symptom items consisting of Gastrointestinal Symptom Rating Scale and Postgastrectomy Syndrome Assessment Scale (PGSAS) specific items were consolidated into seven symptom subscales as PGSAS symptom subscales (SS). This radar chart demonstrated the worse conditions of postgastrectomy syndromes (PGS) in total gastrectomy (TGRY) group than that in distal gastrectomy (DGRY) group; B: The radar graph consisting of each score of items related to the life status and the dissatisfactions demonstrated the worse conditions of PGS in TGRY group than that in DGRY group.
- Citation: Takahashi M, Terashima M, Kawahira H, Nagai E, Uenosono Y, Kinami S, Nagata Y, Yoshida M, Aoyagi K, Kodera Y, Nakada K. Quality of life after total vs distal gastrectomy with Roux-en-Y reconstruction: Use of the Postgastrectomy Syndrome Assessment Scale-45. World J Gastroenterol 2017; 23(11): 2068-2076
- URL: https://www.wjgnet.com/1007-9327/full/v23/i11/2068.htm
- DOI: https://dx.doi.org/10.3748/wjg.v23.i11.2068


