Copyright
©The Author(s) 2016.
World J Gastroenterol. Feb 14, 2016; 22(6): 2060-2070
Published online Feb 14, 2016. doi: 10.3748/wjg.v22.i6.2060
Published online Feb 14, 2016. doi: 10.3748/wjg.v22.i6.2060
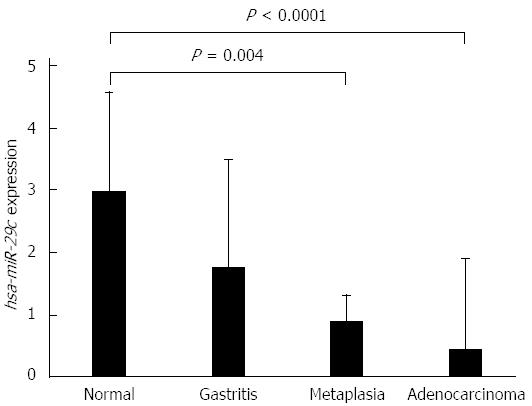
Figure 1 Expression values of hsa-miR-29c in samples of normal gastric mucosa, non-atrophic chronic gastritis, intestinal metaplasia and intestinal-type gastric adenocarcinoma, respectively (values in log scale).
P values were obtained by ANOVA test (adjusted by using Bonferroni’s correction).
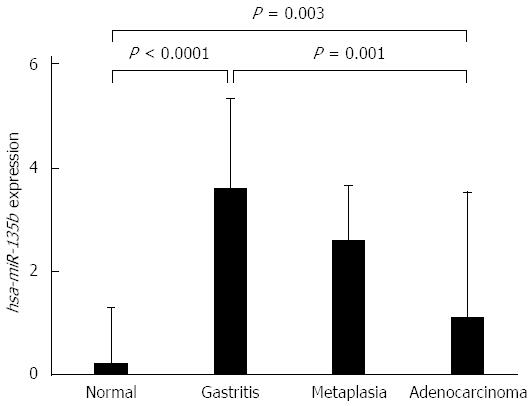
Figure 2 Expression values of hsa-miR-135b in samples of normal gastric mucosa, non-atrophic chronic gastritis, intestinal metaplasia and intestinal-type gastric adenocarcinoma, respectively (values in log scale).
P values were obtained by ANOVA test (adjusted by using Bonferroni’s correction).
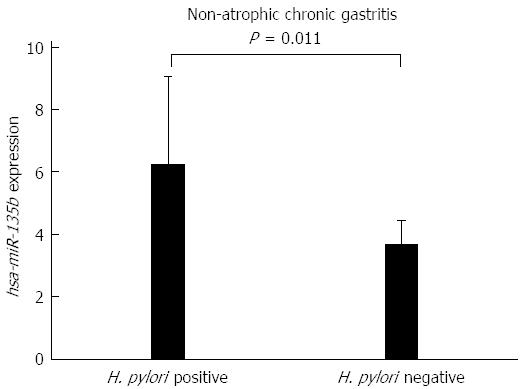
Figure 3 Comparison of the expression values of hsa-miR-135b between samples of Helicobacter pylori-positive non-atrophic chronic gastritis and Helicobacter pylori-negative non-atrophic chronic gastritis (P = 0.
011). H. pylori: Helicobacter pylori.
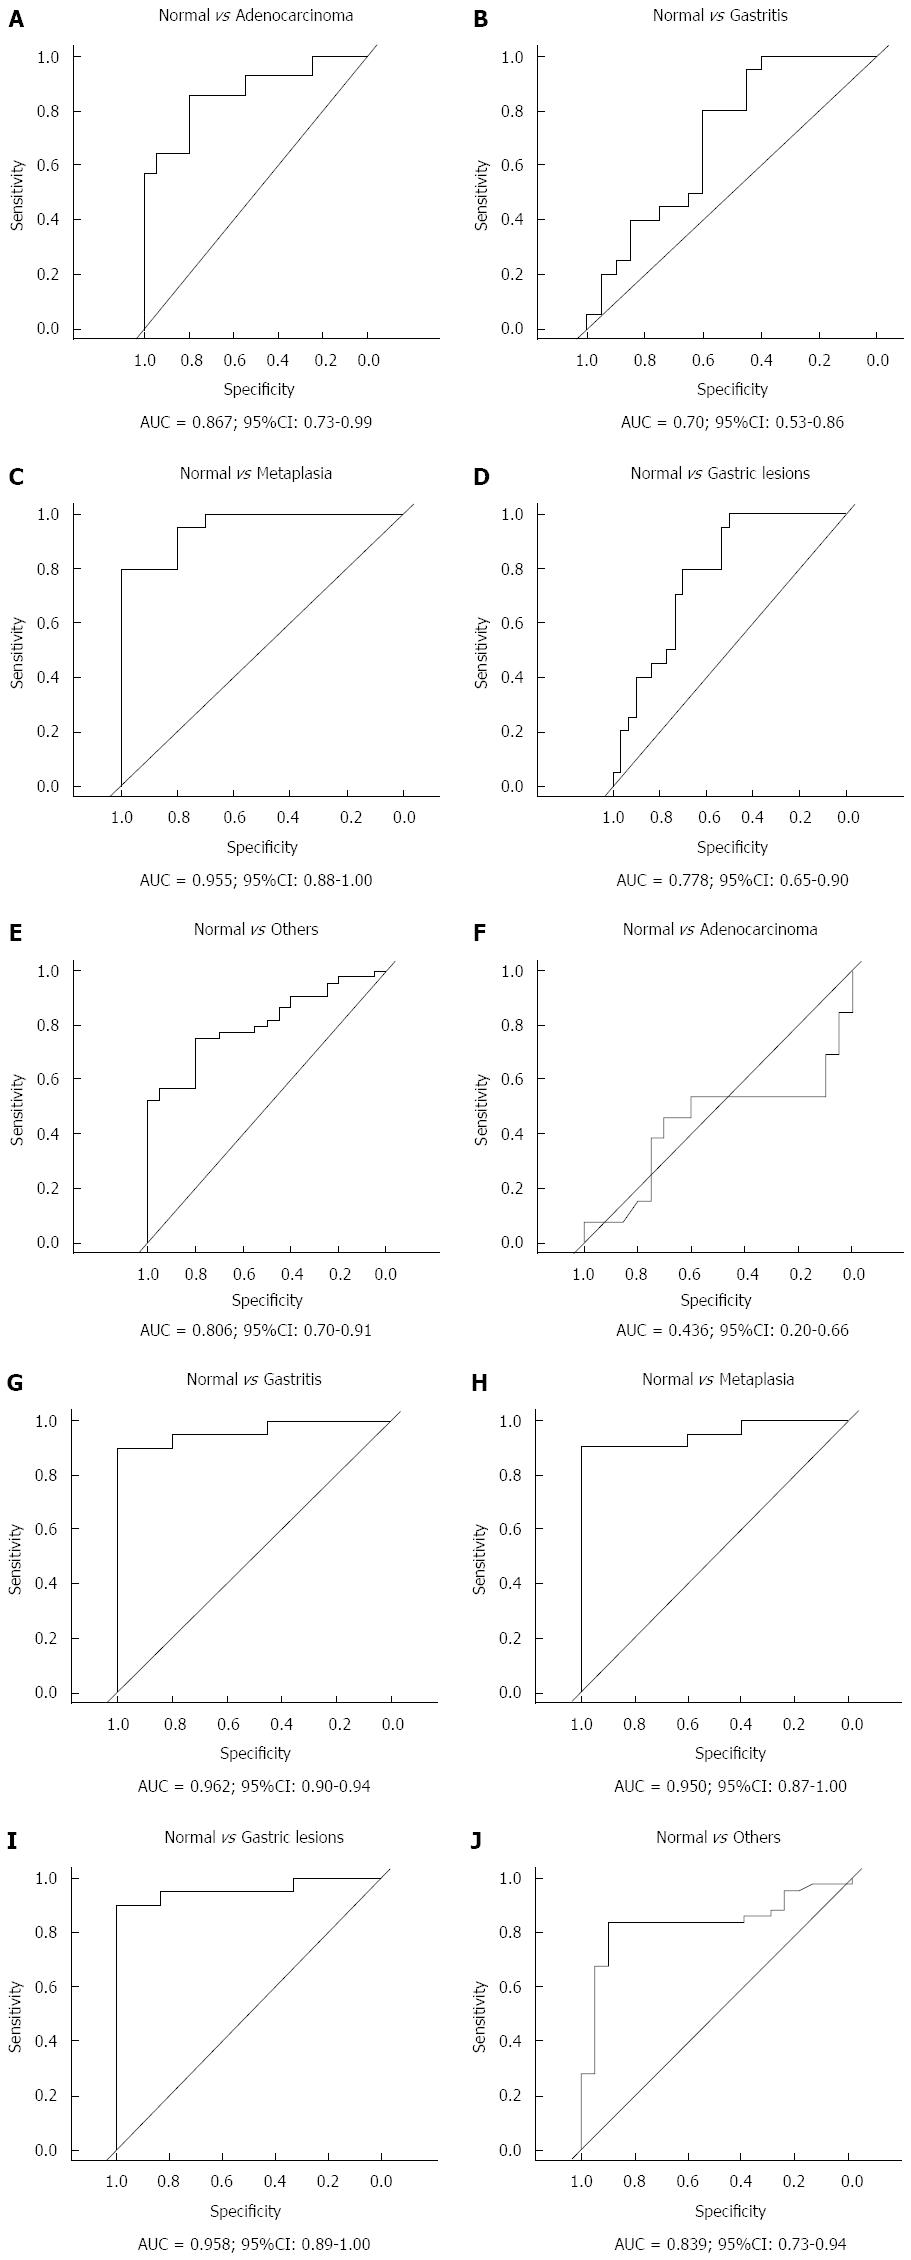
Figure 4 Receiver operating characteristic curve analysis of hsa-miR-29c (A-E) and hsa-miR-135b (F-J) expression.
Gastric lesions: Non-atrophic chronic gastritis and intestinal metaplasia; Others: Non-atrophic chronic gastritis, intestinal metaplasia and intestinal-type gastric adenocarcinoma; AUC: Area under the curve.
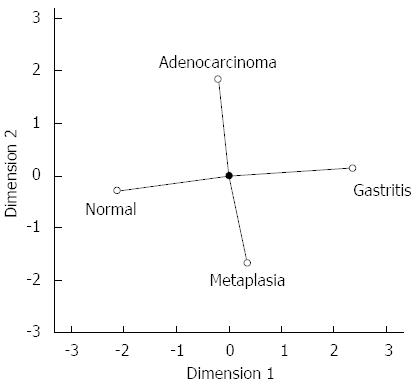
Figure 5 Categorical principal components analysis of hsa-miR-29c expression in two dimensions.
Vectors making 180-degree indicate they are closely and negatively related. Vectors making a 90-degree angle indicate they are not related.
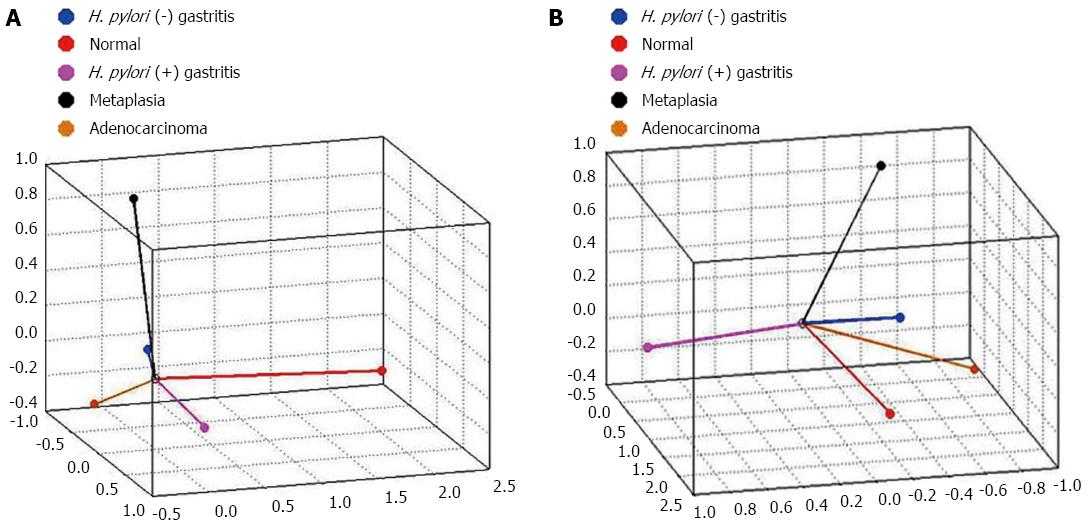
Figure 6 Categorical principal components analysis of hsa-miR-135b expression in three dimensions in two different angles (A and B).
Vectors making 180-degree indicate they are closely and negatively related. Vectors making a 90-degree angle indicate they are not related. H. pylori: Helicobacter pylori.
- Citation: Vidal AF, Cruz AM, Magalhães L, Pereira AL, Anaissi AK, Alves NC, Albuquerque PJ, Burbano RM, Demachki S, Ribeiro-dos-Santos Â. hsa-miR-29c and hsa-miR-135b differential expression as potential biomarker of gastric carcinogenesis. World J Gastroenterol 2016; 22(6): 2060-2070
- URL: https://www.wjgnet.com/1007-9327/full/v22/i6/2060.htm
- DOI: https://dx.doi.org/10.3748/wjg.v22.i6.2060


