Copyright
©The Author(s) 2016.
World J Gastroenterol. Dec 7, 2016; 22(45): 10002-10008
Published online Dec 7, 2016. doi: 10.3748/wjg.v22.i45.10002
Published online Dec 7, 2016. doi: 10.3748/wjg.v22.i45.10002
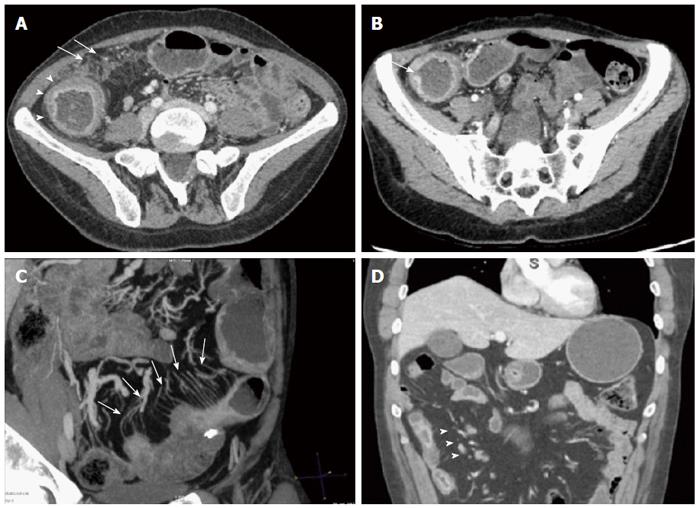
Figure 1 Computed tomography enterography shows signs of inflammatory activity in patients with inflammatory bowel disease.
A: Mucosal hyperenhancement, wall thickening with mural stratification (arrowheads), mesenteric fat stranding (arrows); B: Mucosal ulcerations (arrow); C: Hypervascularity of the involved mesentery (comb sign) (arrows); D: Enlarged mesenteric lymph nodes (arrowheads).
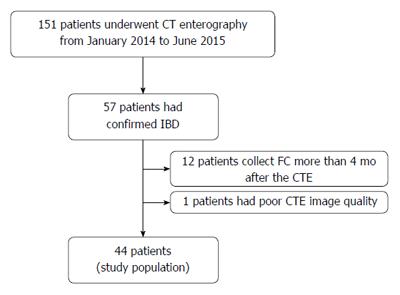
Figure 2 Selection of patients for the retrospective study with all the patients undergoing fecal calprotectin within 4 mo.
CTE: Computed tomography enterography; IBD: inflammatory bowel disease.
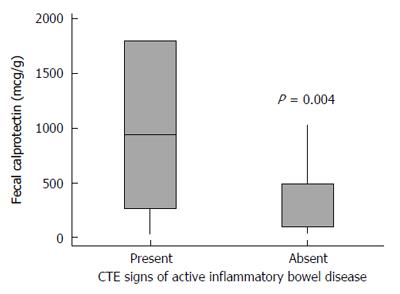
Figure 3 Fecal calprotectin levels in patients with and without signs of active inflammatory disease in computed tomography enterography.
CTE: Computed tomography enterography.
- Citation: Horvat N, Tavares CC, Andrade AR, Cabral JCS, Leao-Filho HM, Caiado AHM, Ueda SKN, Leite AZA, Sipahi AM, Rocha MS. Inter- and intraobserver agreement in computed tomography enterography in inflammatory bowel disease. World J Gastroenterol 2016; 22(45): 10002-10008
- URL: https://www.wjgnet.com/1007-9327/full/v22/i45/10002.htm
- DOI: https://dx.doi.org/10.3748/wjg.v22.i45.10002


