Copyright
©The Author(s) 2016.
World J Gastroenterol. Nov 28, 2016; 22(44): 9765-9774
Published online Nov 28, 2016. doi: 10.3748/wjg.v22.i44.9765
Published online Nov 28, 2016. doi: 10.3748/wjg.v22.i44.9765
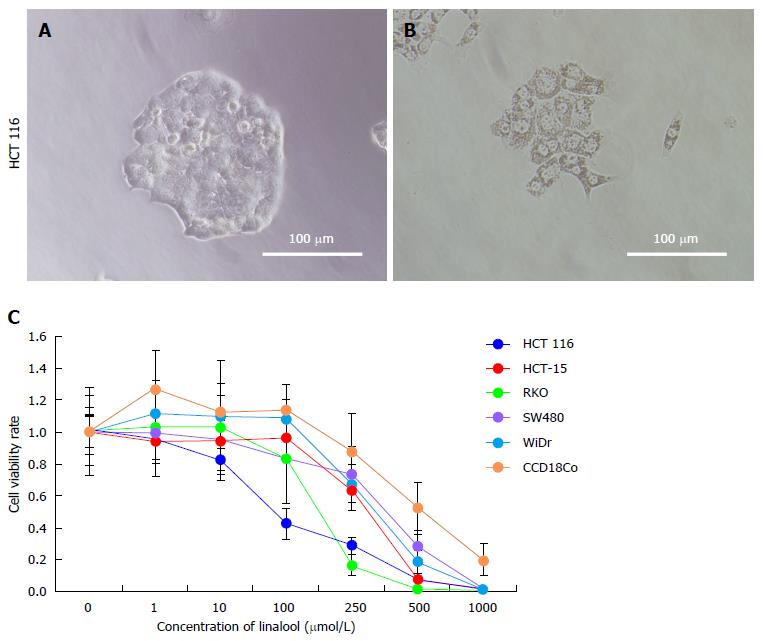
Figure 1 Anticancer effect of linalool.
A: HCT 116 cells in the control group showing rapid proliferation; B: HCT 116 cells treated with 250 μmol/L linalool for 24 h showed shrinkage of cells and tightly packed organelles; C: A dose-dependent increase in the cytotoxic effect of linalool was observed in all cancer cell lines. Values are expressed as mean ± SD (n = 3).
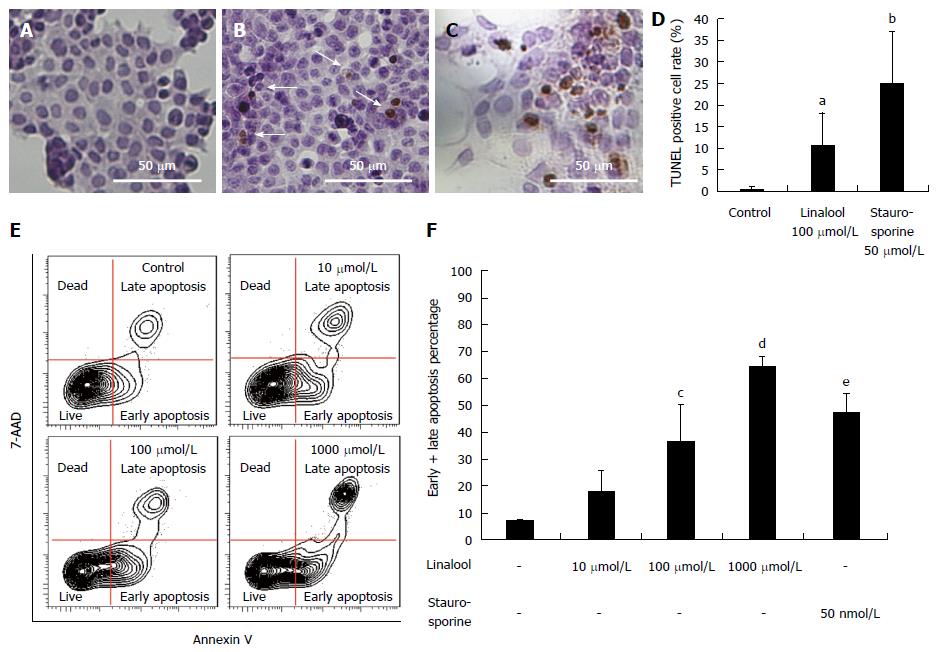
Figure 2 Anticancer mechanism of linalool.
A: TUNEL staining of HCT 116 cells in the control group; B: Staining of HCT 116 cells treated with 100 μmol/L linalool; C: Staining of HCT 116 cells treated with 50 nmol/L staurosporine. The corresponding percentage of TUNEL-positive cells (white arrow) was 0.7% ± 0.7% (A), 10.5% ± 7.7% (B), and 25.1% ± 11.2% (C); D: The percentage of apoptotic cells in each group (mean ± SD, n = 10). aP < 0.05 vs control group; bP < 0.05 vs 100 μmol/L linalool group; E: Flow cytometry using Annexin V for the detection of live cells, cells showing early and late apoptosis, and cell death; F: Percentages of early and late apoptosis fraction. cP < 0.05 vs control group; dP < 0.01 vs control group; eP < 0.05 vs control group; one-way ANOVA followed by Dunnett’s test, n = 3.
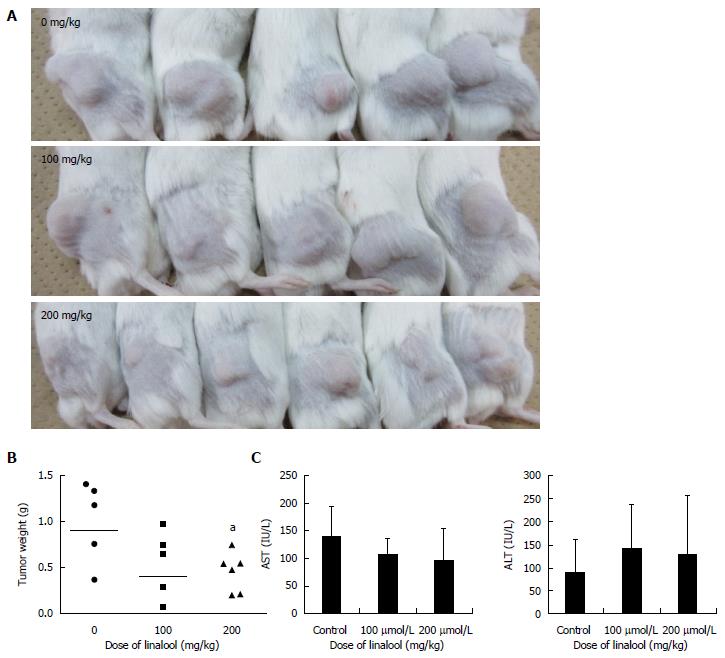
Figure 3 Changes in mouse tumor size and weight after drug administration.
A: The pictures show the size of the tumors in each group. Upper: control group. Middle: 100 mg/kg linalool group. Lower: 200 mg/kg linalool group. As concentration of linalool increased, the xenografted tumor size decreased macroscopically; B: Tumor weight after removal showed a significant decrease in the group of 200 mg/kg administration, compared to that of control group [expressed as geometric mean, n = 5 (control), 5 (100 mg/kg linalool), 6 (200 mg/kg linalool)], aP < 0.05 vs control group; one-way ANOVA followed by Dunnett’s test); C: No significant change was detected in serum AST and ALT level in each group; values are expressed as mean ± SD, n = 5 (control), 5 (100 mg/kg linalool), 6 (200 mg/kg linalool).
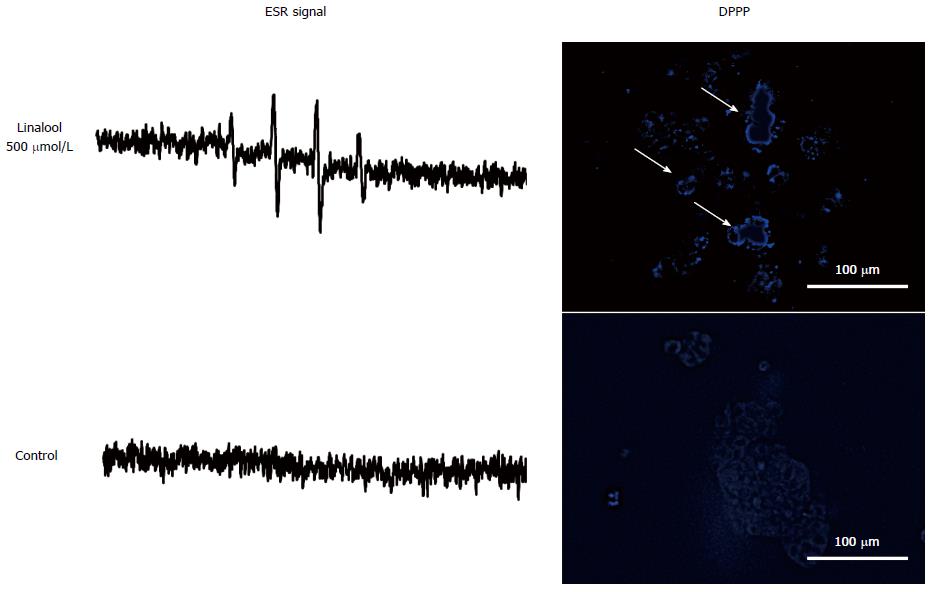
Figure 4 Oxidative stress assay in vitro.
A: Electron spin resonance (ESR) spectroscopy performed 30 min after linalool treatment. The signal intensity of 1:2:2:1 suggests generation of hydroxyl radical, the strongest reactive oxygen species (ROS); B: The signal of HCT 116 without linalool at the same time period; C: Diphenyl-1-pyrenylphosphine (DPPP) assay performed to detect lipid peroxidation showed that linalool induced cell membrane lipid peroxidation as green fluorescent on the cell surface(white arrow); D: The cell membrane lipid peroxidation was not observed in without linalool treatment group.
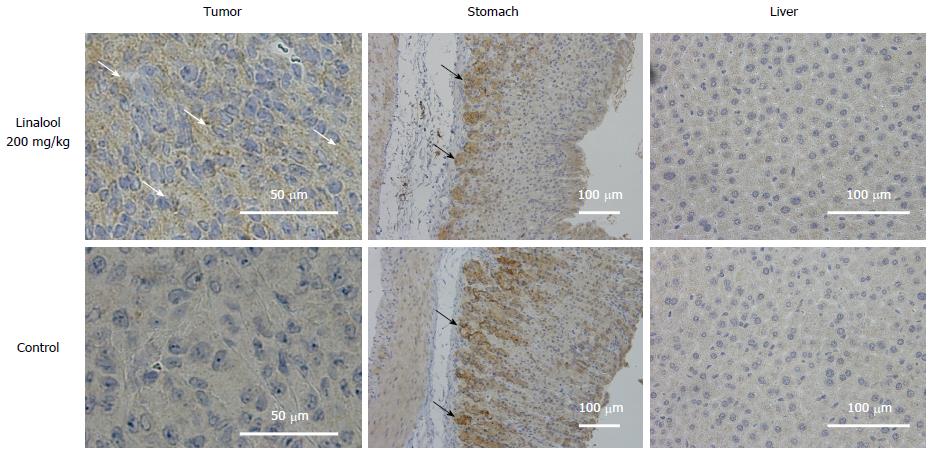
Figure 5 Oxidative stress assay in vivo.
Although accumulation of 4-hydroxynonenal (4-HNE) was observed in the tumors from the high-dose linalool group, it was not observed in stomach or liver tissues, except for the physiological accumulation (black arrow) of 4-HNE near the basal membrane of the stomach.
- Citation: Iwasaki K, Zheng YW, Murata S, Ito H, Nakayama K, Kurokawa T, Sano N, Nowatari T, Villareal MO, Nagano YN, Isoda H, Matsui H, Ohkohchi N. Anticancer effect of linalool via cancer-specific hydroxyl radical generation in human colon cancer. World J Gastroenterol 2016; 22(44): 9765-9774
- URL: https://www.wjgnet.com/1007-9327/full/v22/i44/9765.htm
- DOI: https://dx.doi.org/10.3748/wjg.v22.i44.9765


