Copyright
©The Author(s) 2016.
World J Gastroenterol. Nov 28, 2016; 22(44): 9752-9764
Published online Nov 28, 2016. doi: 10.3748/wjg.v22.i44.9752
Published online Nov 28, 2016. doi: 10.3748/wjg.v22.i44.9752
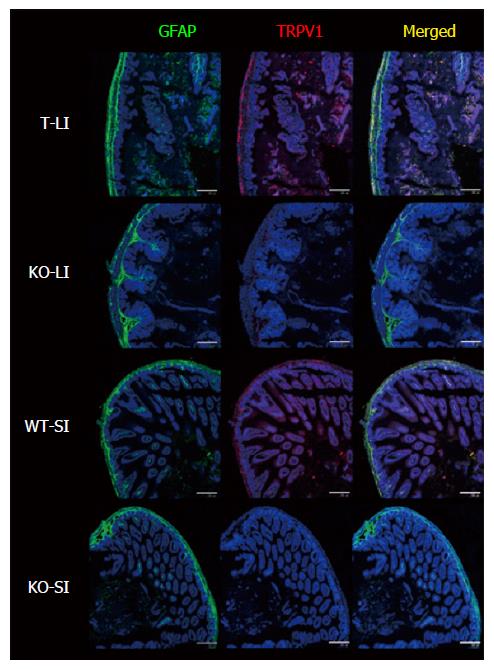
Figure 1 Double-immunostaining with GFAP and TRPV1 of small and large intestines of wild-type and transient receptor potential vanilloid 1-deficient mice.
The degree of GFAP-IR signal observed in the enteric nervous system was similar in WT and KO mice. TRPV1-IR signal was observed only in WT mice and was located in a confined area of the smooth muscle layer. Nuclei were stained with TO-PRO3. Representative data from 2 experiments using 2 mice per time point are shown. Scale bar represents 200 μm. TRPV1: Transient receptor potential vanilloid 1; SI: Small intestine; LI: Large intestine; WT: Wild-type; KO: Knockout; GFAP: Glial fibrillary acidic protein.
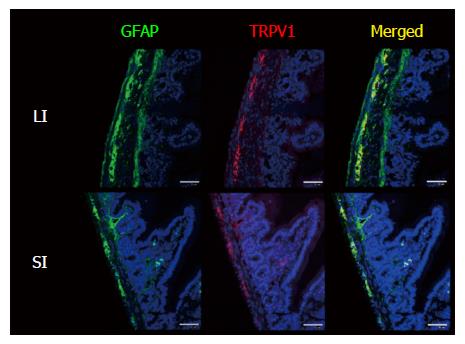
Figure 2 Enlarged view of GFAP/TRPV1-stained small intestine and large intestine of wild-type mice.
Certain parts of Figure 1 were magnified. GFAP is located in the myenteric plexus, submucosal plexus and fibrous structures penetrating into the circular muscle layer and mucosal layer (in WT LI, the serosal membrane was also stained with GFAP; however, serosal membrane is known to show false-positive immunosignals with various antibodies). The location of the TRPV1-IR signal coincided with some portions of the GFAP-IR signal in the myenteric plexus. Nuclei were stained with TO-PRO3. Representative data from 2 experiments using 2 mice per time point are shown. Scale bar represents 50 μm. GFAP: Glial fibrillary acidic protein; TRPV1: Transient receptor potential vanilloid 1; SI: Small intestine; LI: Large intestine; WT: Wild-type.
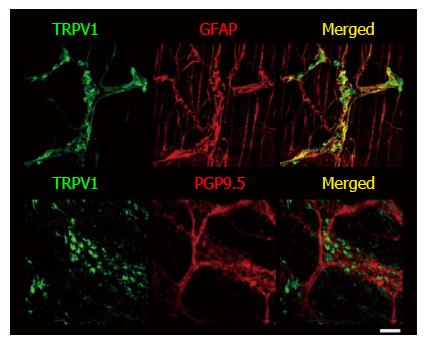
Figure 3 Double-immunostaining with TRPV1 and GFAP or PGP9.
5 of large intestine longitudinal muscle layer-myenteric plexus of wild-type mice. LM-MP was isolated from 5-wk-old mice and whole-mount immunohistochemistry was performed as described in Materials and Methods. TRPV1 stained both cell bodies and fibers, while GFAP stained mainly fibers and some portions of their IR signals were co-localized. Co-localization of PGP9.5 and TRPV1-IR signals was not observed. Nuclei were stained with DAPI. Representative data from 2 experiments using 2 mice per time point are shown. Scale bar represents 50 μm. TRPV1: Transient receptor potential vanilloid 1; GFAP: Glial fibrillary acidic protein; LM-MP: Longitudinal muscle layer-myenteric plexus; WT: Wild-type.
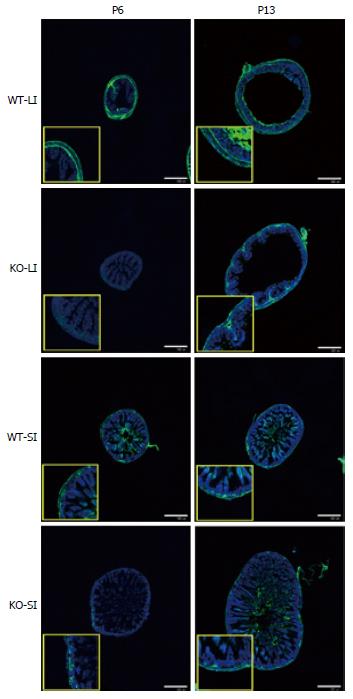
Figure 4 Difference of glial fibrillary acidic protein immunosignals between wild-type and knockout mice (image).
Large intestine (LI) and small intestine (SI) samples were isolated from WT and KO mice on postnatal day (PD) 6 and PD 13. While the GFAP-IR signal was similar in WT and KO mice on PD 13, the signal on PD 6 was weaker in KO mice than in WT mice, both in SI and LI. Nuclei were stained with TO-PRO3. Representative data of an experiment using 6 mice per each time point/group. Scale bar represents 500 μm. GFAP: Glial fibrillary acidic protein; WT: wild-type; KO: Knockout.
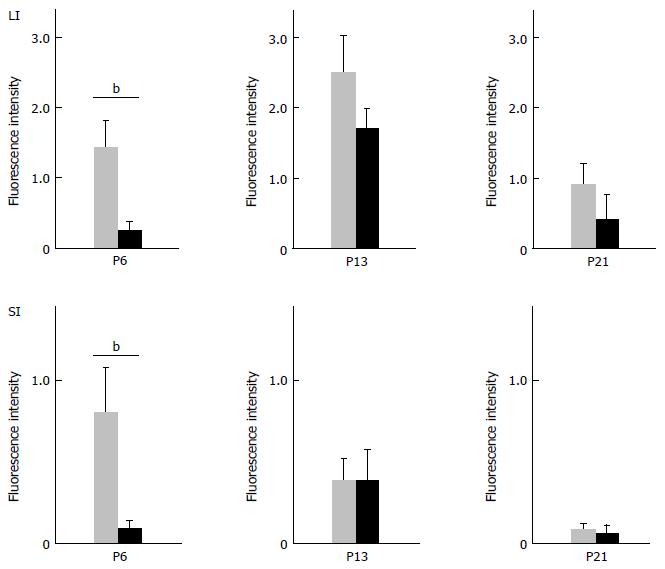
Figure 5 Difference in glial fibrillary acidic protein-IR signals between wild-type and knockout mice.
The intensity of GFAP-IR signal for WT and KO mice on postnatal day (PD) 6, PD 13 and PD 21 was quantitated by imaging analysis as described in Materials and Methods. The amount of GFAP-IR fluorescence was normalized to the circumferential length of the intestinal tract. Data represent mean ± SEM, n = 5-6. bP < 0.01. GFAP-IR: Glial fibrillary acidic protein; WT: Wild-type; KO: Knockout.
Figure 6 Specific decrease in the number of myenteric plexus cells in knockout mice.
The cells were prepared from longitudinal muscle layer-myenteric plexus (LM-MP) of wild-type (WT) and KO mice simultaneously, using the same digestion solution in a single preparation. After 11-d culture, the numbers of α smooth muscle actin (αSMA)+ smooth muscle cells (SMCs), glial fibrillary acidic protein (GFAP)+ cells and αSMA-GFAP- cells were determined as described in Materials and Methods. Nuclei were stained with DAPI. The percentage of GFAP+ cells and SMCs was calculated as the ratio of the number of each cell population to the number of total DAPI+ cells. The yield of enteric glial cells (EGCs, GFAP+ cells) in KO mice was significantly lower than that in WT mice, while the number of SMCs obtained was similar for both types of mice. Data represent mean ± SEM, n = 4. bP < 0.01. KO: Knockout.
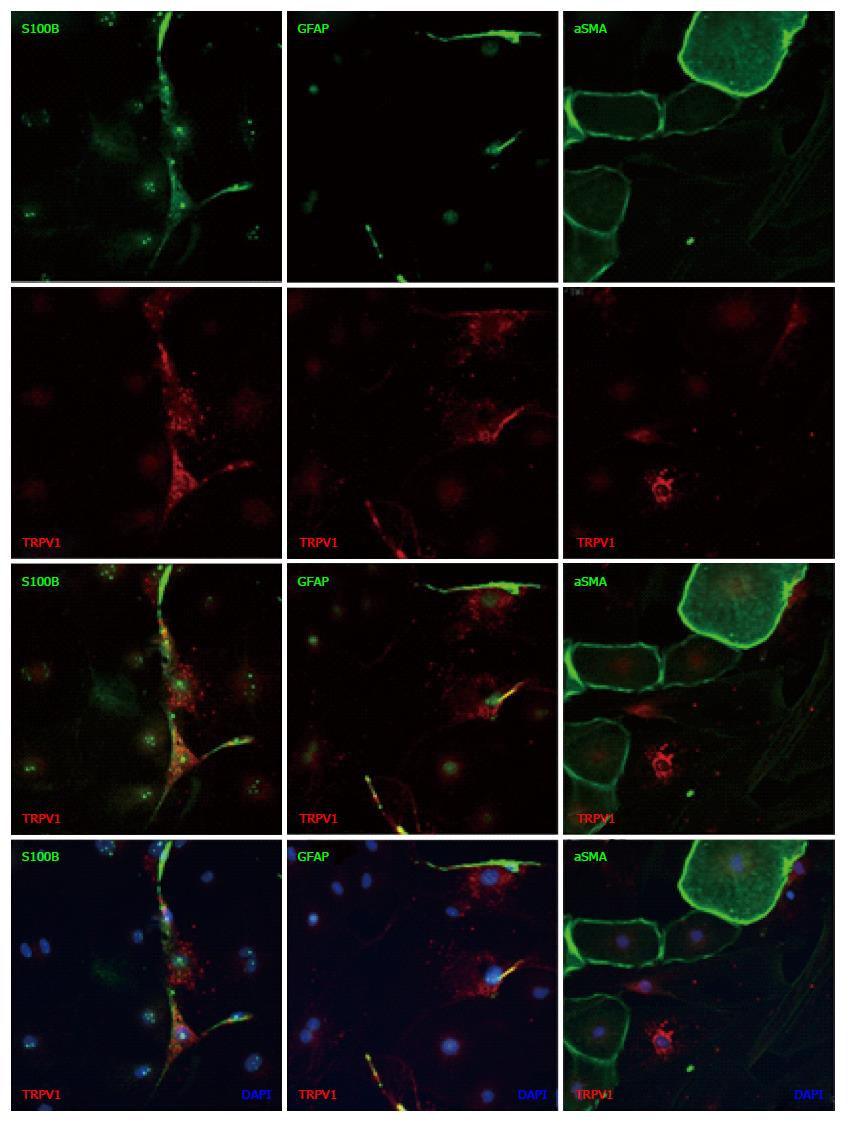
Figure 7 Immunostaining of transient receptor potential vanilloid 1 in enriched enteric glial cell culture.
EGCs were isolated and cultured as described in Materials and Methods. The cells were labeled with antibodies to glial fibrillary acidic protein (GFAP), S100B or smooth muscle cell (SMC). The cultures contained many EGCs and a small percentage of SMCs. The location of TRPV1-IR signal coincided with that of the GFAP-IR signal and the S100B-IR signal, but not with that of the αSMA-IR signal. Nuclei were stained with DAPI. Scale bar represents 20 μm. TRPV1: Transient receptor potential vanilloid 1; EGC: Enriched enteric glial cell.
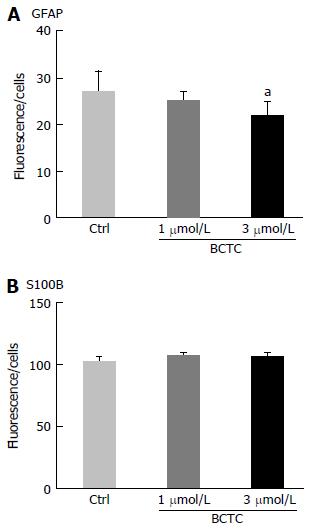
Figure 8 Effect of transient receptor potential vanilloid 1 agonist/antagonist on the signal ratio of glial fibrillary acidic protein-IR to S100B-IR.
Enriched enteric glial cells [EGCs; prepared from day 5 myenteric plexus cells (MPCs) and smooth muscle cells (SMCs) co-culture] were plated and cultured for an additional 5 d. The TRPV1 antagonist BCTC was added and after 24 h the cells were fixed. The cells were stained with antibodies and imaging analysis was performed using a Celaview system as described in Materials and Methods. BCTC (3 μmol/L) decreased the GFAP-IR signal but the S-100B-IR signal was unchanged. Data represent mean ± SEM, n = 5-8. aP < 0.05. TRPV1: Transient receptor potential vanilloid 1; GFAP: Glial fibrillary acidic protein.
- Citation: Yamamoto M, Nishiyama M, Iizuka S, Suzuki S, Suzuki N, Aiso S, Nakahara J. Transient receptor potential vanilloid 1-immunoreactive signals in murine enteric glial cells. World J Gastroenterol 2016; 22(44): 9752-9764
- URL: https://www.wjgnet.com/1007-9327/full/v22/i44/9752.htm
- DOI: https://dx.doi.org/10.3748/wjg.v22.i44.9752


