Copyright
©The Author(s) 2016.
World J Gastroenterol. Nov 21, 2016; 22(43): 9534-9543
Published online Nov 21, 2016. doi: 10.3748/wjg.v22.i43.9534
Published online Nov 21, 2016. doi: 10.3748/wjg.v22.i43.9534
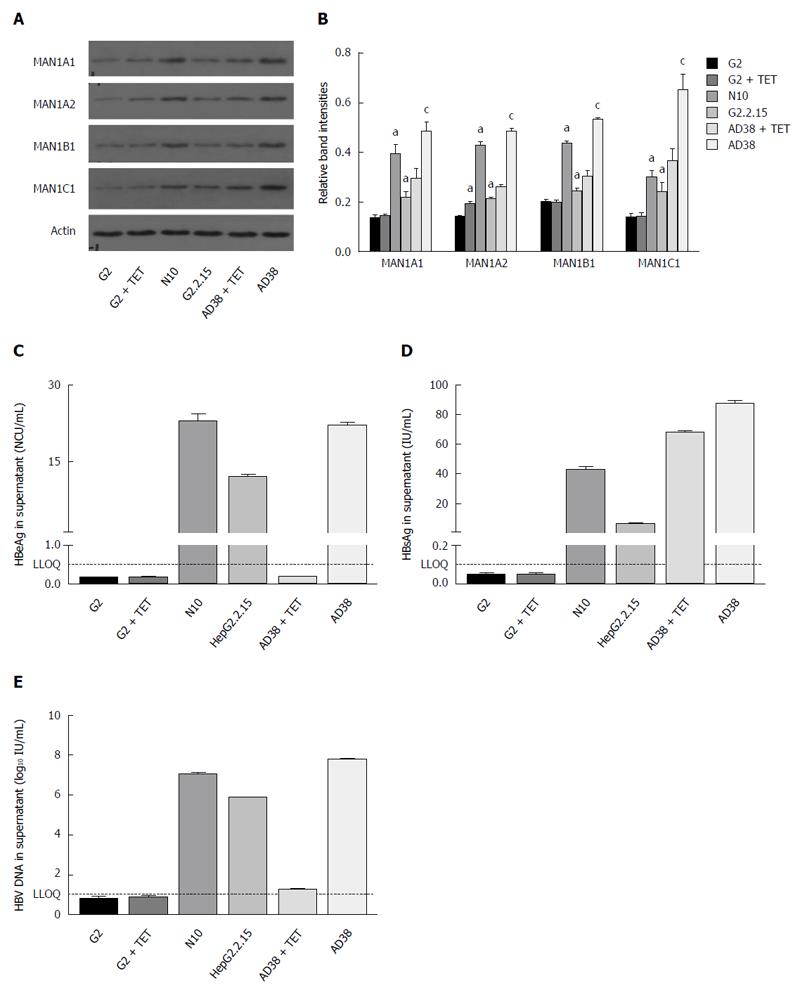
Figure 1 α-1,2-mannosidase expression and the replication and viral protein expression profiles in hepatitis B virus stably transfected cells.
A: Western blot indicating that α-1,2-mannosidase expression is significantly increased in all HBV stably transfected cells; B: Quantification of the band intensities normalized by ACTIN is shown. MAN1A1, MANA2, MAN1B1, and MAN1C1 protein levels in the HepG2.2.15 and N10 cell lines with stable HBV transfection were higher than in HepG2 cells. The α-1,2-mannosidase expression in the AD38 cells without Tet was higher than in cells with Tet. The data shown represent the mean ± SD of three independent experiments. aP < 0.05 vs HepG2 controls; cP < 0.05 vs AD38 cell line treated with TET. Secretion of HBeAg (C), HBsAg (D) and HBV-DNA (E) in the cell culture supernatant of various HBV cell lines. LLOQ: Lower limit of quantification.
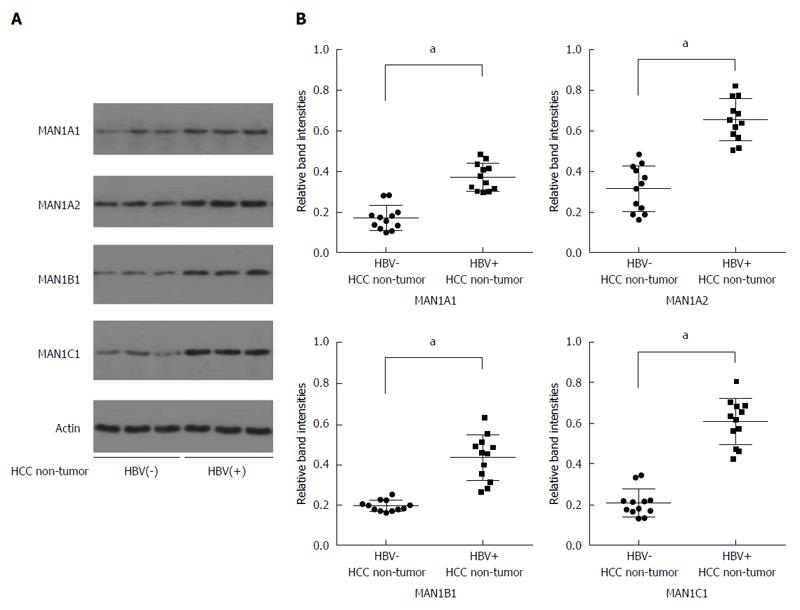
Figure 2 α-1,2-mannosidase expression of hepatitis B virus-related and hepatitis B virus-unrelated hepatocellular carcinoma patient liver samples.
A: Representative western blot illustrating the α-1,2-mannosidase protein expression in HBV-related and HBV-unrelated hepatocellular carcinoma (HCC) patient liver samples; B: Quantification of α-1,2-mannosidase from the band intensities normalized by ACTIN. Levels of α-1,2-mannosidase in non-tumorous liver tissues in the HBV-related HCC patients were higher than in the tissues from non-HBV-related HCC patients, aP < 0.05.
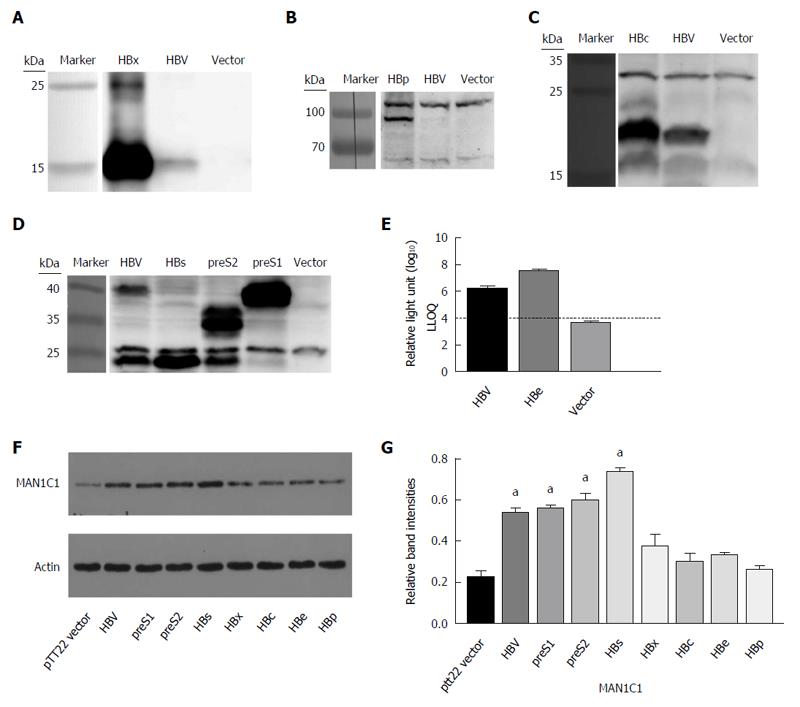
Figure 3 α-1,2-mannosidases are upregulated in the HBs, preS2 and preS1-transfected hepatoma cells.
Hepatitis B virus protein expression and effect on MAN1C1 (A) Western blot indicating the HBs, preS2 and preS1 expression in PTT22-HBs, PTT22-preS2, and PTT22-preS1 transfected cells; B: Western blot indicating the HBx expression in PTT22-HBx transfected cells; C: Western blot indicating the HBp expression in PTT22-HBp transfected cells; D: Western blot indicating the HBc expression in PTT22-HBc transfected cells; E: ELISA indicating the HBe expression in PTT22-HBe transfected cells; F: Western blot indicating that MAN1C1 expression is significantly increased in PTT22-HBs, PTT22-preS2, and PTT22-preS1 transfected cells; G: Quantification of MAN1C1 from the band intensities normalized by ACTIN. aP < 0.05 vs PTT22 vector controls. The data shown represent the mean ± SD of three independent experiments. HBV: Plasmids (PTT22-HBV) were transfected into HepG2 cells. HBs: Plasmids (PTT22-HBs) were transfected into HepG2 cells. preS2: Plasmids (PTT22-preS2) were transfected into HepG2 cells. preS1: Plasmids (PTT22-HBV) were transfected into HepG2 cells. HBx: Plasmids (PTT22-HBx) were transfected into HepG2 cells. HBp: Plasmids (PTT22- HBp) were transfected into HepG2 cells. HBc: Plasmids (PTT22-HBc) were transfected into HepG2 cells. vector: Plasmids (PTT22-GFP) were transfected into HepG2 cells. LLOQ: Lower limit of quantification.
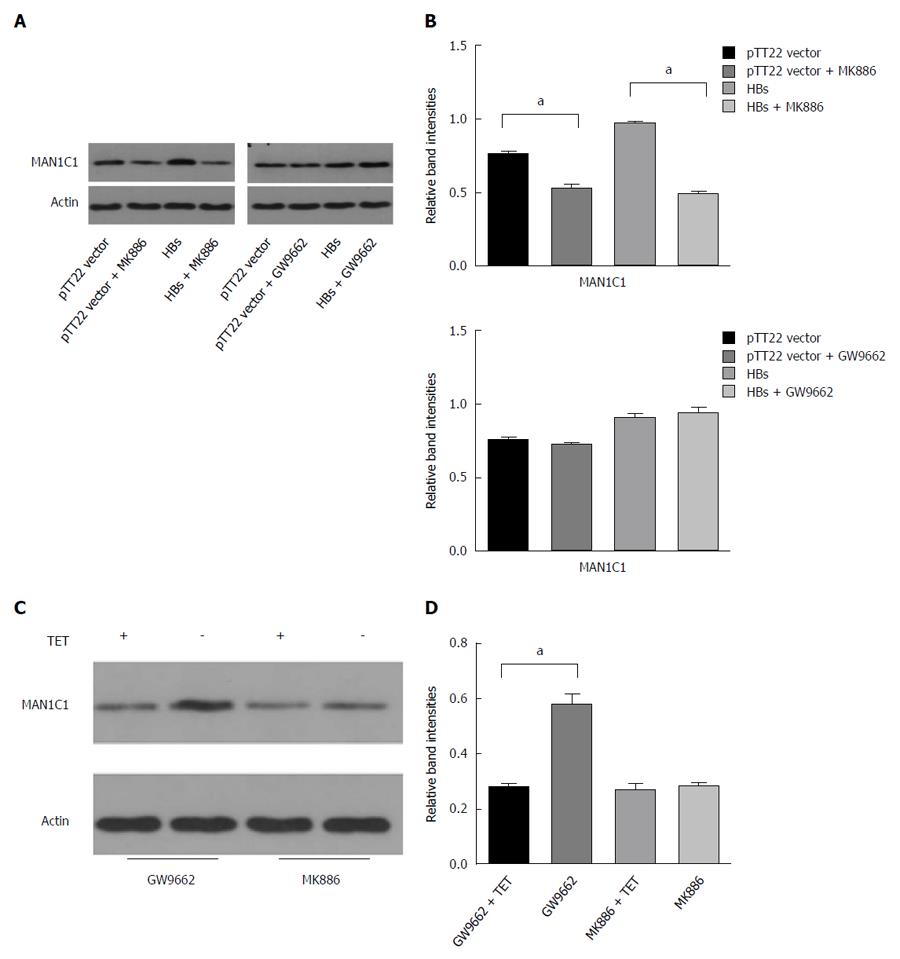
Figure 4 MK886 can neutralize the effects of hepatitis B virus.
MK886 neutralizes the effects of HBV on MAN1C1 (A) Western blot indicating that the MAN1C1 expression significantly increased in HepG2 cells transfected with PTT22-HBs in the presence of GW9662 but not MK886. B: Quantification of MAN1C1 expression from the band intensities normalized by ACTIN. C: Western blot showed that after the addition of MK886, the expression of MAN1C1 did not alter in HepAD38 cells without Tet as compared to that in the HepAD38 cells with Tet. Moreover, there was no effect of GW9662 on the expression of MAN1C1 in AD38 cells with or without Tet treatment. D: Quantification of the α-1,2-mannosidases expression from the band intensities normalized by ACTIN. The data shown represent the mean ± SD of three independent experiments, aP < 0.05.
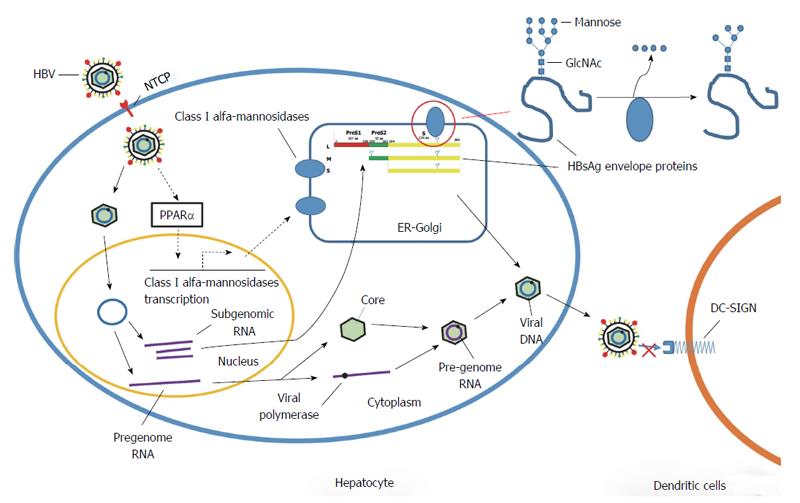
Figure 5 Overall mechanisms of hepatitis B virus escape from host-related immunity with a focus on the role of class I alfa-mannosidases via the PPAR-alfa pathway.
Hepatitis B virus infection increases the expression of class I alfa-mannosidases via the PPARα signaling pathway. The surface of HBV envelope proteins could be glycosylated by the class I alfa-mannosidases. In turn, DC-SIGN can no longer recognize the HBV glycoprotein coat, allowing the virus to escape from immune attack. NTCP: Sodium taurocholate cotransporting polypeptide; ER-Golgi: Endoplasmic reticulum and/or Golgi; GlcNAc: N-acetyl-d-glucosamine.
- Citation: Hu S, Jiang LB, Zou XJ, Yi W, Tian DY. Hepatitis B virus upregulates host expression of α-1,2-mannosidases via the PPARα pathway. World J Gastroenterol 2016; 22(43): 9534-9543
- URL: https://www.wjgnet.com/1007-9327/full/v22/i43/9534.htm
- DOI: https://dx.doi.org/10.3748/wjg.v22.i43.9534


