Copyright
©The Author(s) 2016.
World J Gastroenterol. Nov 14, 2016; 22(42): 9445-9450
Published online Nov 14, 2016. doi: 10.3748/wjg.v22.i42.9445
Published online Nov 14, 2016. doi: 10.3748/wjg.v22.i42.9445
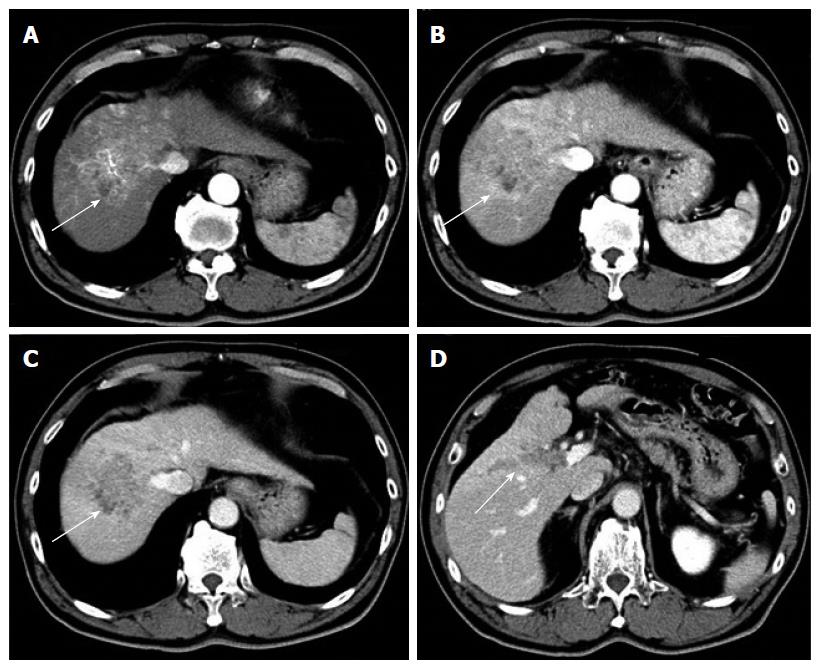
Figure 1 Contrast-enhanced computed tomography before sorafenib introduction.
Heterogeneous hypervascularized tumor (A-C, arrow) in the right paramedian sector, showing early enhancement in the arterial phase and wash-out in the late phase together with portal vein tumor thrombosis (D, arrow) limited to the first-order branch and invading the right portal vein.
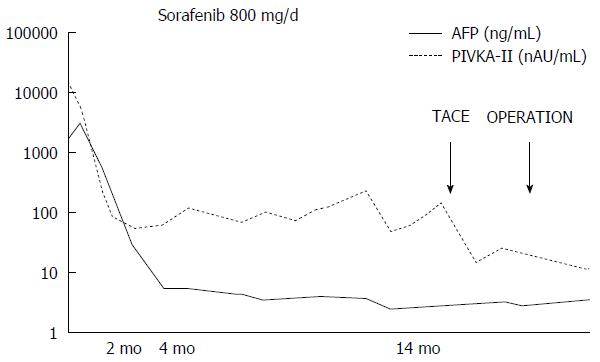
Figure 2 Clinical course as assessed by tumor markers and therapeutic events.
AFP: α-fetoprotein; PIVKA-II: Vitamin K absence or antagonist-II; TACE: Transcatheter arterial chemoembolization.
Figure 3 Two months after sorafenib induction.
Computed tomography showed the significantly decrease in size (3 cm) and hypervascularization (A and B, arrow), and portal vein tumor thrombosis remained in the second-order branch of portal vein (C, arrow).
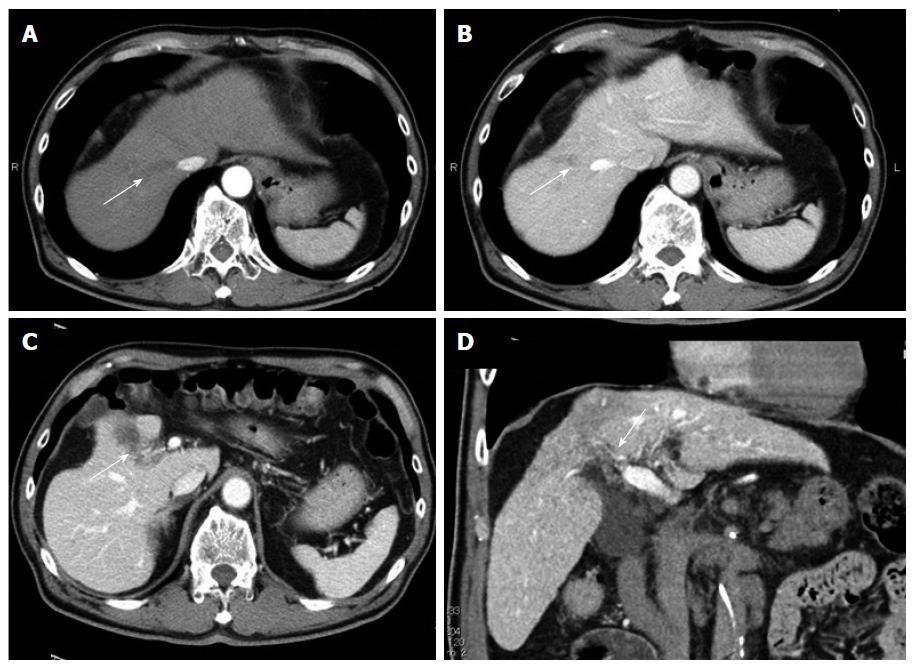
Figure 4 Fourteen months after sorafenib induction.
Computed tomography revealed the tumor disappearance (A and B, arrow) and the residual portal vein tumor thrombosis (C and D, arrow) in the right anterior portal vein.
Figure 5 Angiography 14 mo after sorafenib induction.
A: Portography revealed filling defect in S8 (arrow); B: Digital subtraction arteriography showed irregular shaped tumor stain (arrow); C: Transcatheter arterial chemoembolization was performed with 30 mg of mirpulatin, 3 mL of lipiodol and gelatin sponge particle.
- Citation: Takano M, Kokudo T, Miyazaki Y, Kageyama Y, Takahashi A, Amikura K, Sakamoto H. Complete response with sorafenib and transcatheter arterial chemoembolization in unresectable hepatocellular carcinoma. World J Gastroenterol 2016; 22(42): 9445-9450
- URL: https://www.wjgnet.com/1007-9327/full/v22/i42/9445.htm
- DOI: https://dx.doi.org/10.3748/wjg.v22.i42.9445


